from sklearn.linear_model import LinearRegression
import pandas as pd
from palmerpenguins import load_penguins

# Load and clean data
penguins = load_penguins()
df = penguins.dropna()
X = df[["bill_length_mm"]]
y = df["body_mass_g"]

# Fit model
model = LinearRegression()
model.fit(X, y)

# Predict
y_pred = model.predict(X)Make a model
Lecture 3
Dr. Benjamin Soltoff
Cornell University
INFO 4940/5940 - Fall 2025
September 2, 2025
Announcements
Announcements
- Complete Homework 00 by Wednesday at 11:59pm
Learning objectives
- Identify the purpose of a predictive model
- Categorize models based on common characteristics
- Distinguish between interpretable and black-box models
- Evaluate trade-offs between model complexity and interpretability
- Identify packages for defining models in R and Python
- Review the Quarto document format
What is machine learning?

Source: ChatGPT

Image generated using DALL·E
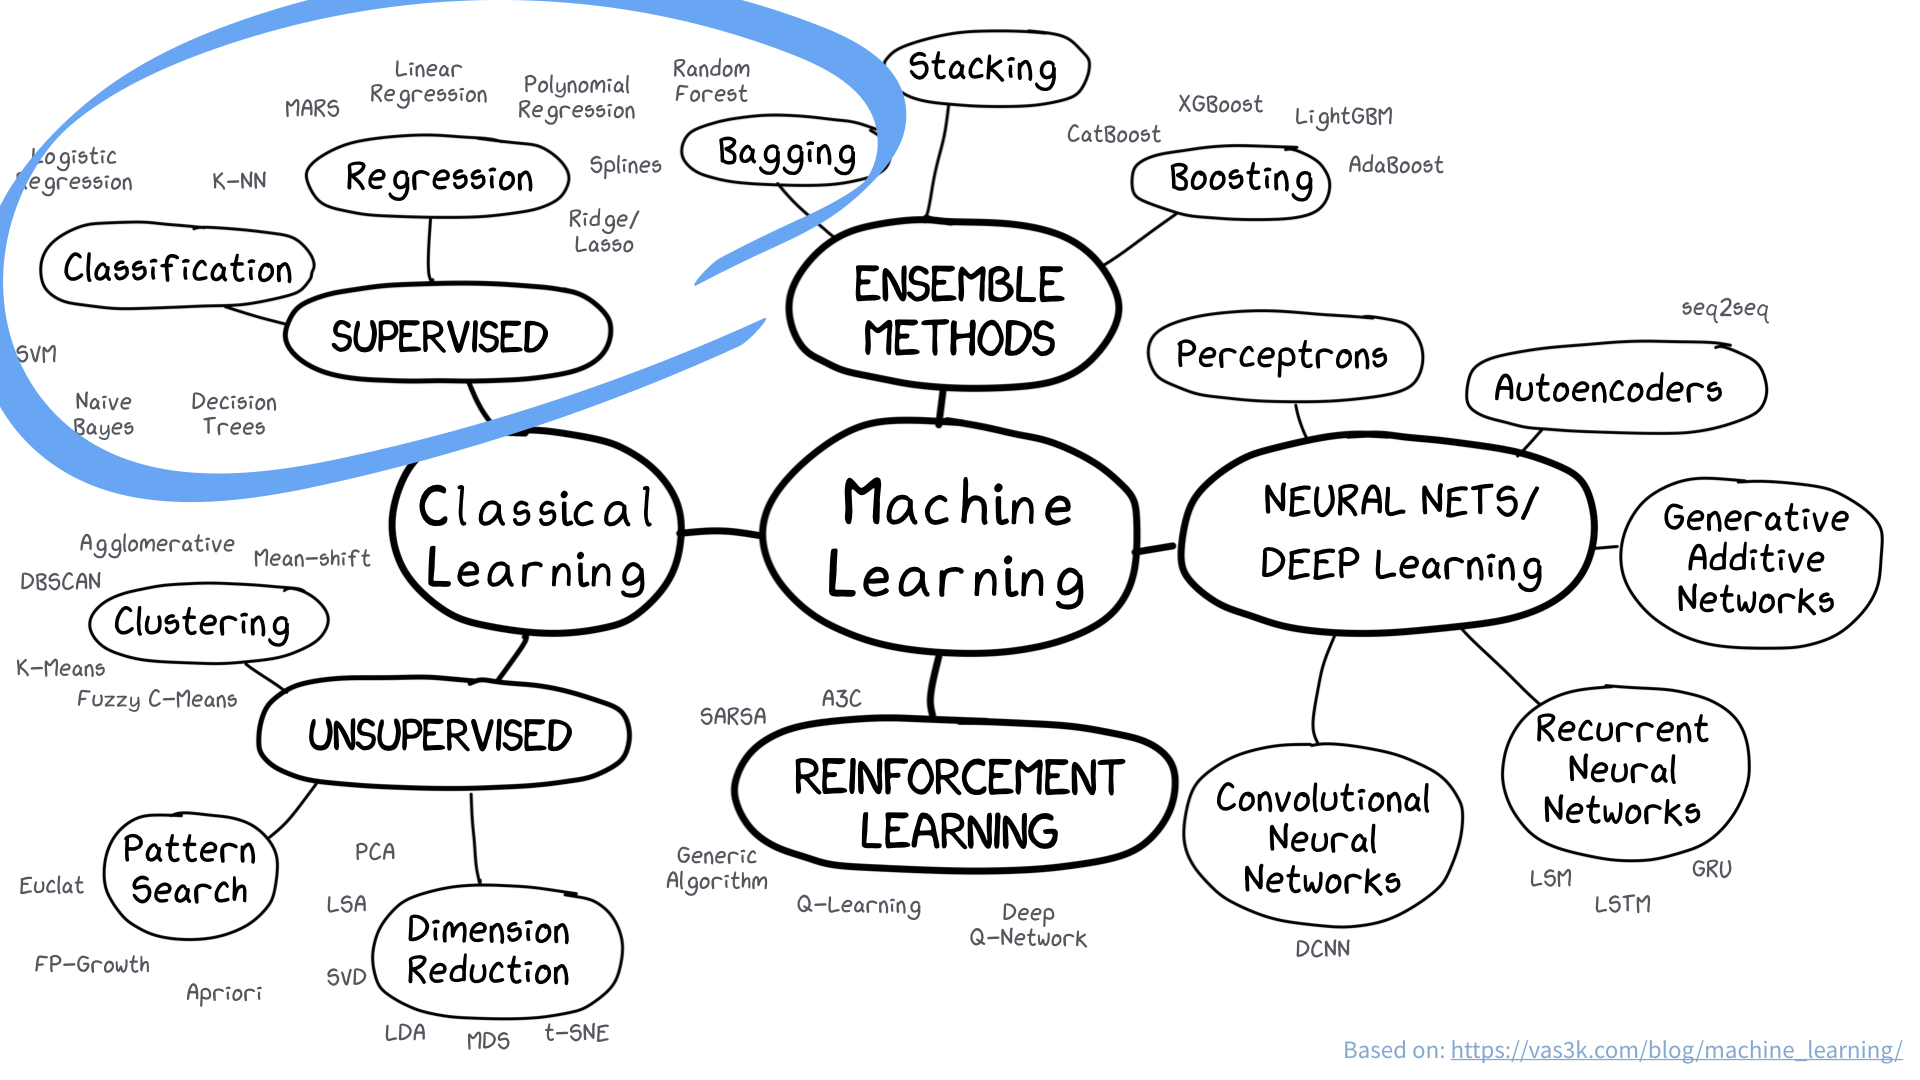
Image credit: https://vas3k.com/blog/machine_learning/
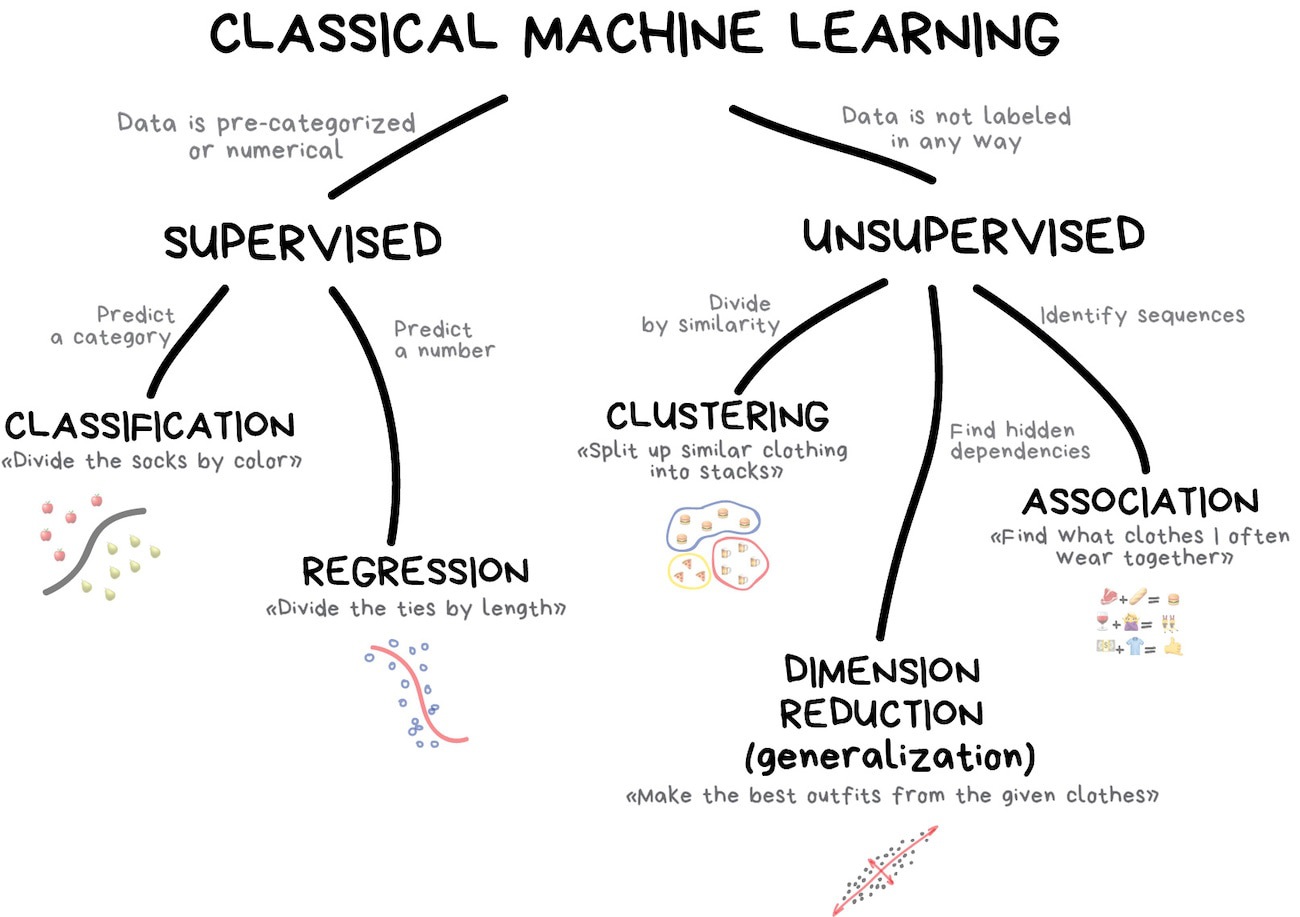
Image credit: https://vas3k.com/blog/machine_learning/
Examples of supervised learning
- Will a user click on this ad?
- Will this property flood in the next year?
- Will a police officer engage in misconduct in the next six months?
- How many individuals will become infected with COVID-19 in the next week?
- What will be the volatility of the stock market over the next month?
Two modes
Classification
Will this home sell in the next 30 days?
Regression
What will the sale price be for this home?
What is the goal of machine learning?
Build models that
generate accurate predictions*
for future, yet-to-be-seen data.
Source: Max Kuhn & Kjell Johnston, http://www.feat.engineering/
Build a model
Predictive models
A computer program that learns from data to make predictions
Many different types of models or algorithms
Common supervised learning models
- Linear regression
- Logistic regression
- Generalized linear models
- Naive Bayes
- Penalized regression (LASSO, Ridge)
- Regression splines
- Local regression
- Generalized additive models
- Multivariate adaptive regression splines (MARS)
- Decision trees
- Bagged trees
- Random forests
- Boosting (GBM, XGBoost, LightGBM, CatBoost)
- Support vector machines
- Neural networks
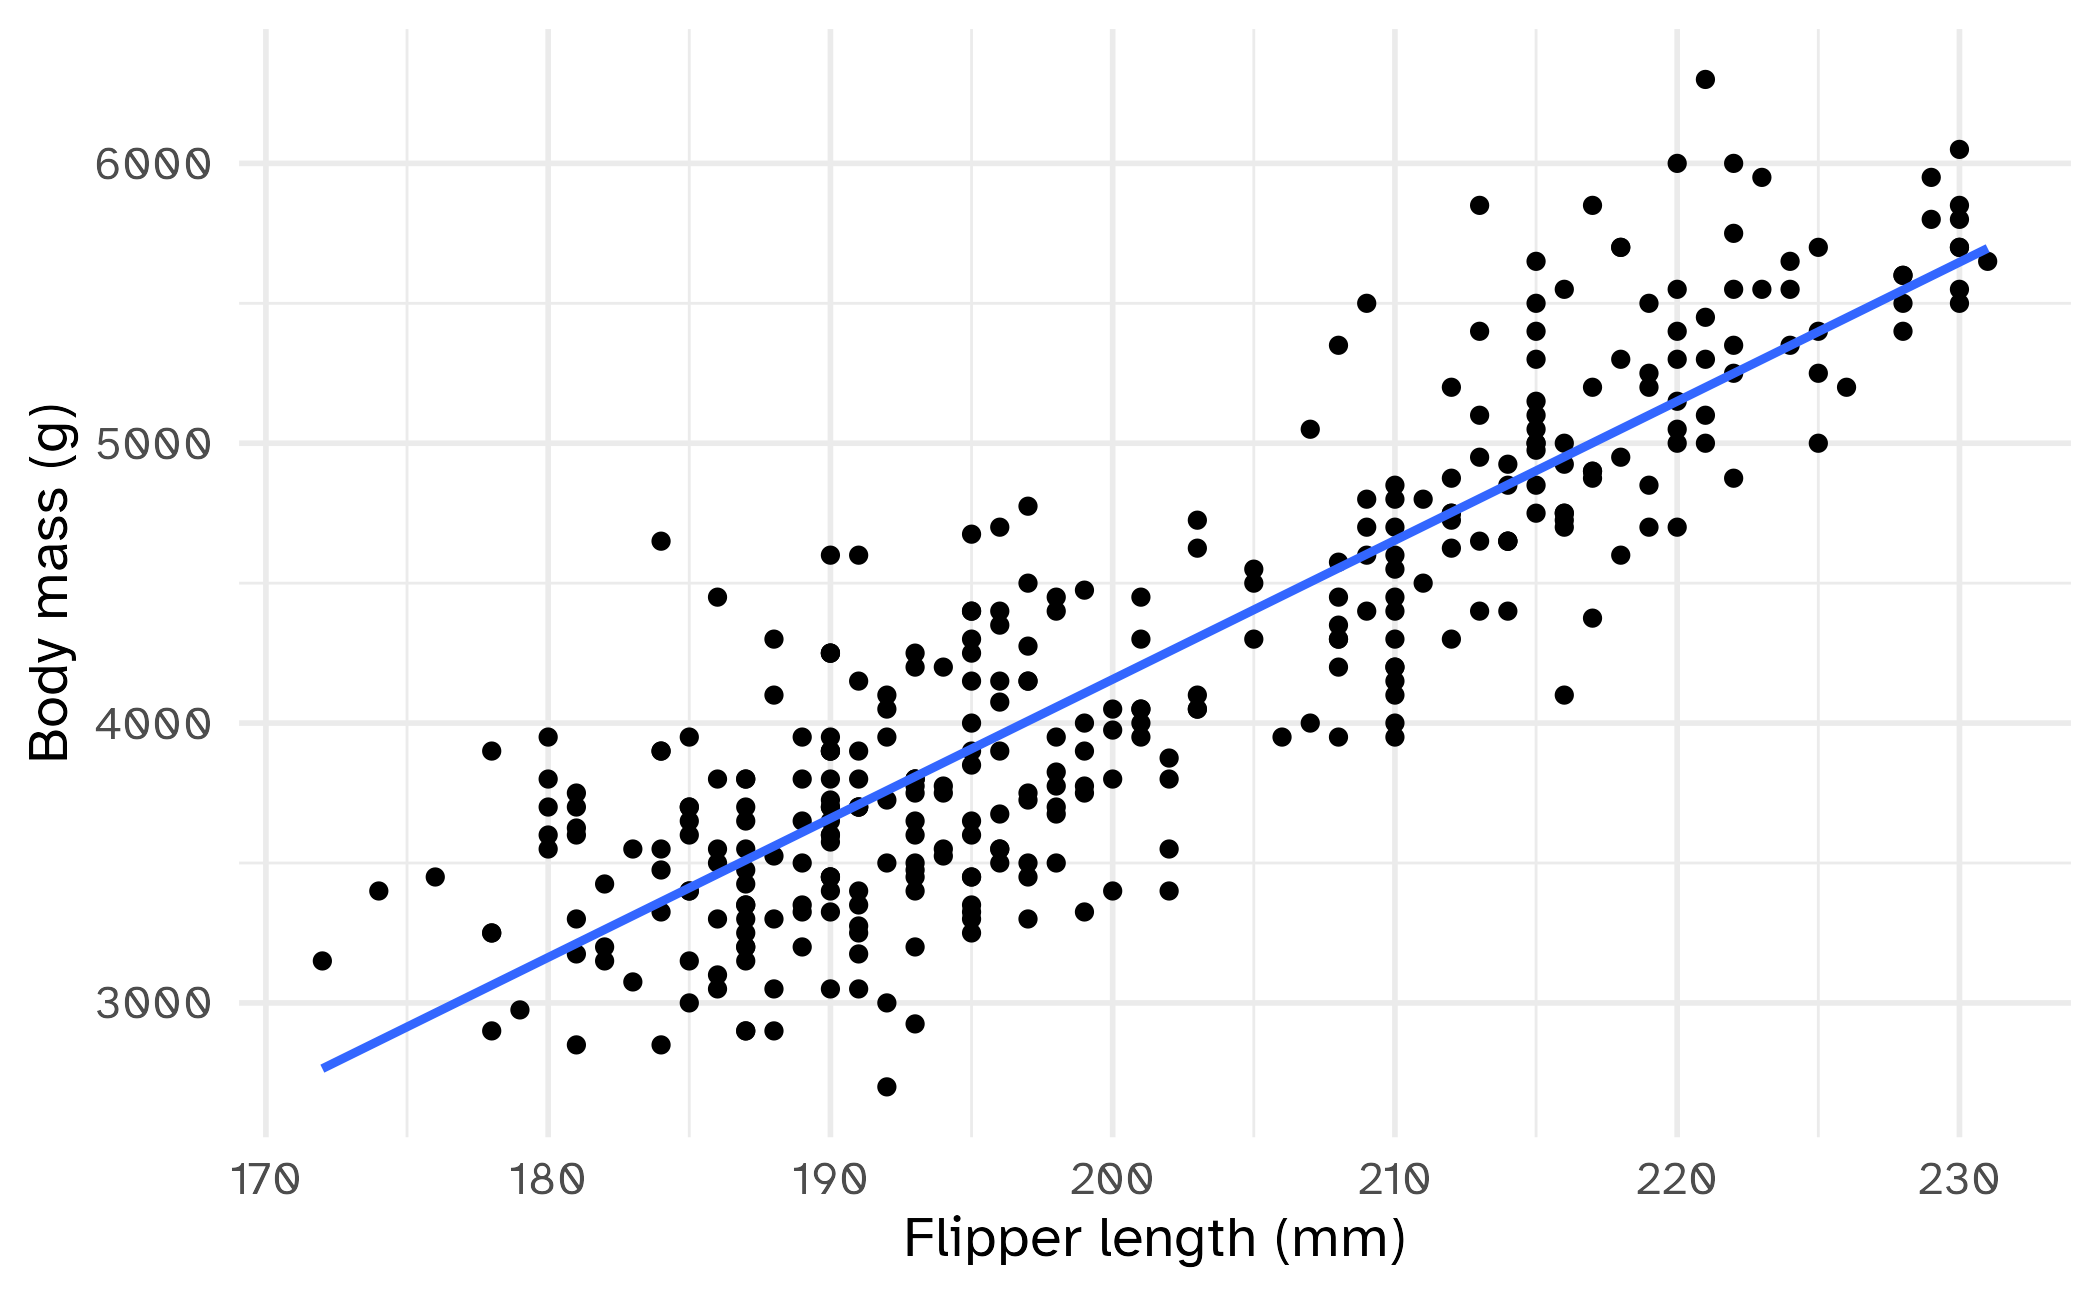
Linear regression
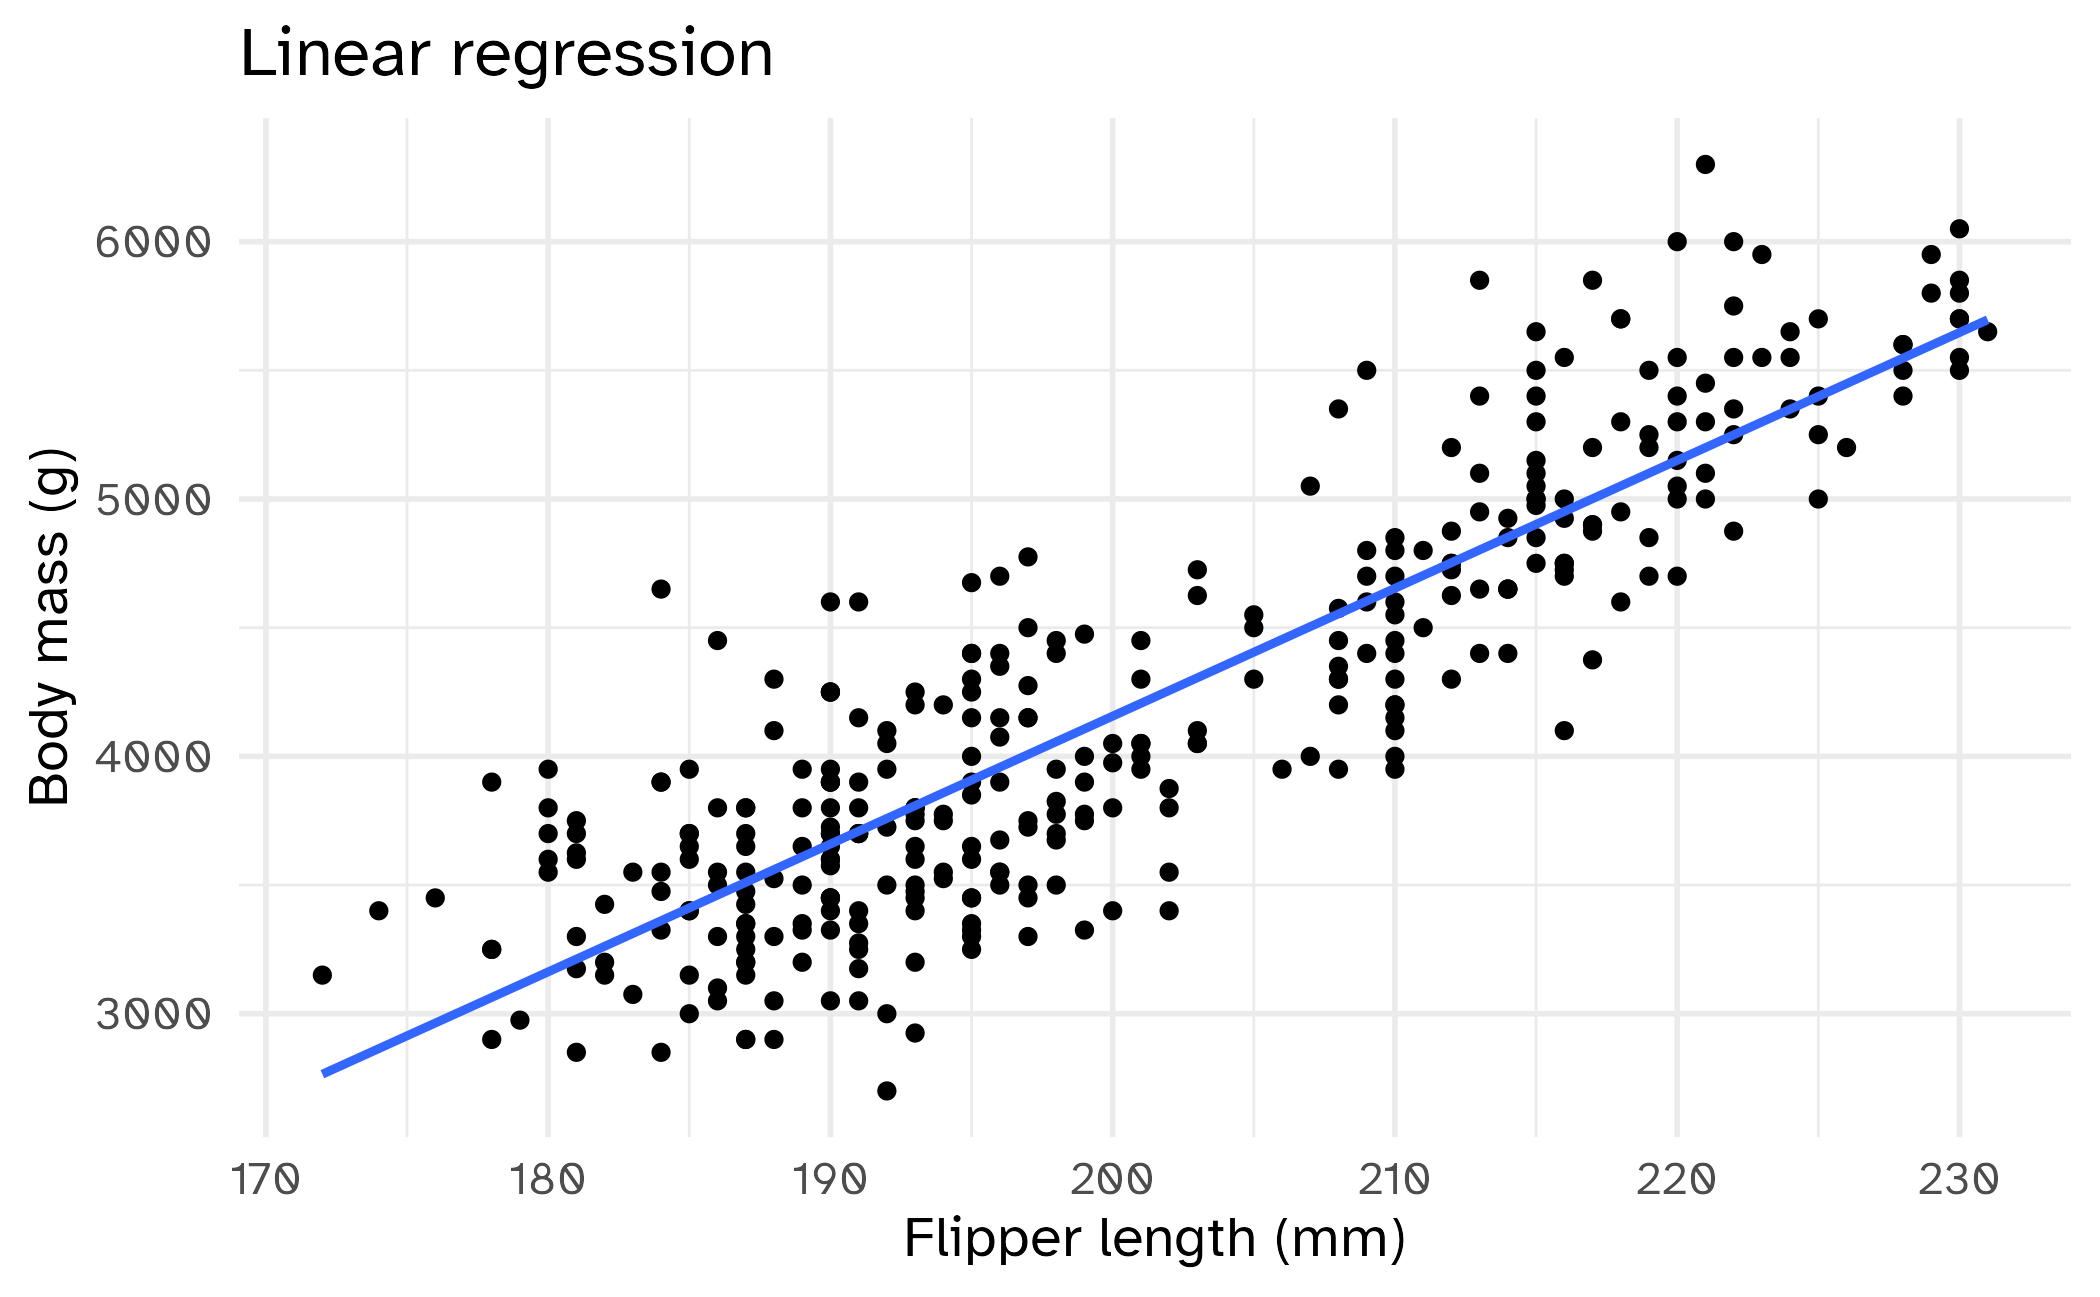
Find an equation that takes the form
\[\hat{Y} = b_0 + b_1 X\]
which minimizes the sum of squared errors (SSE)
Decision tree
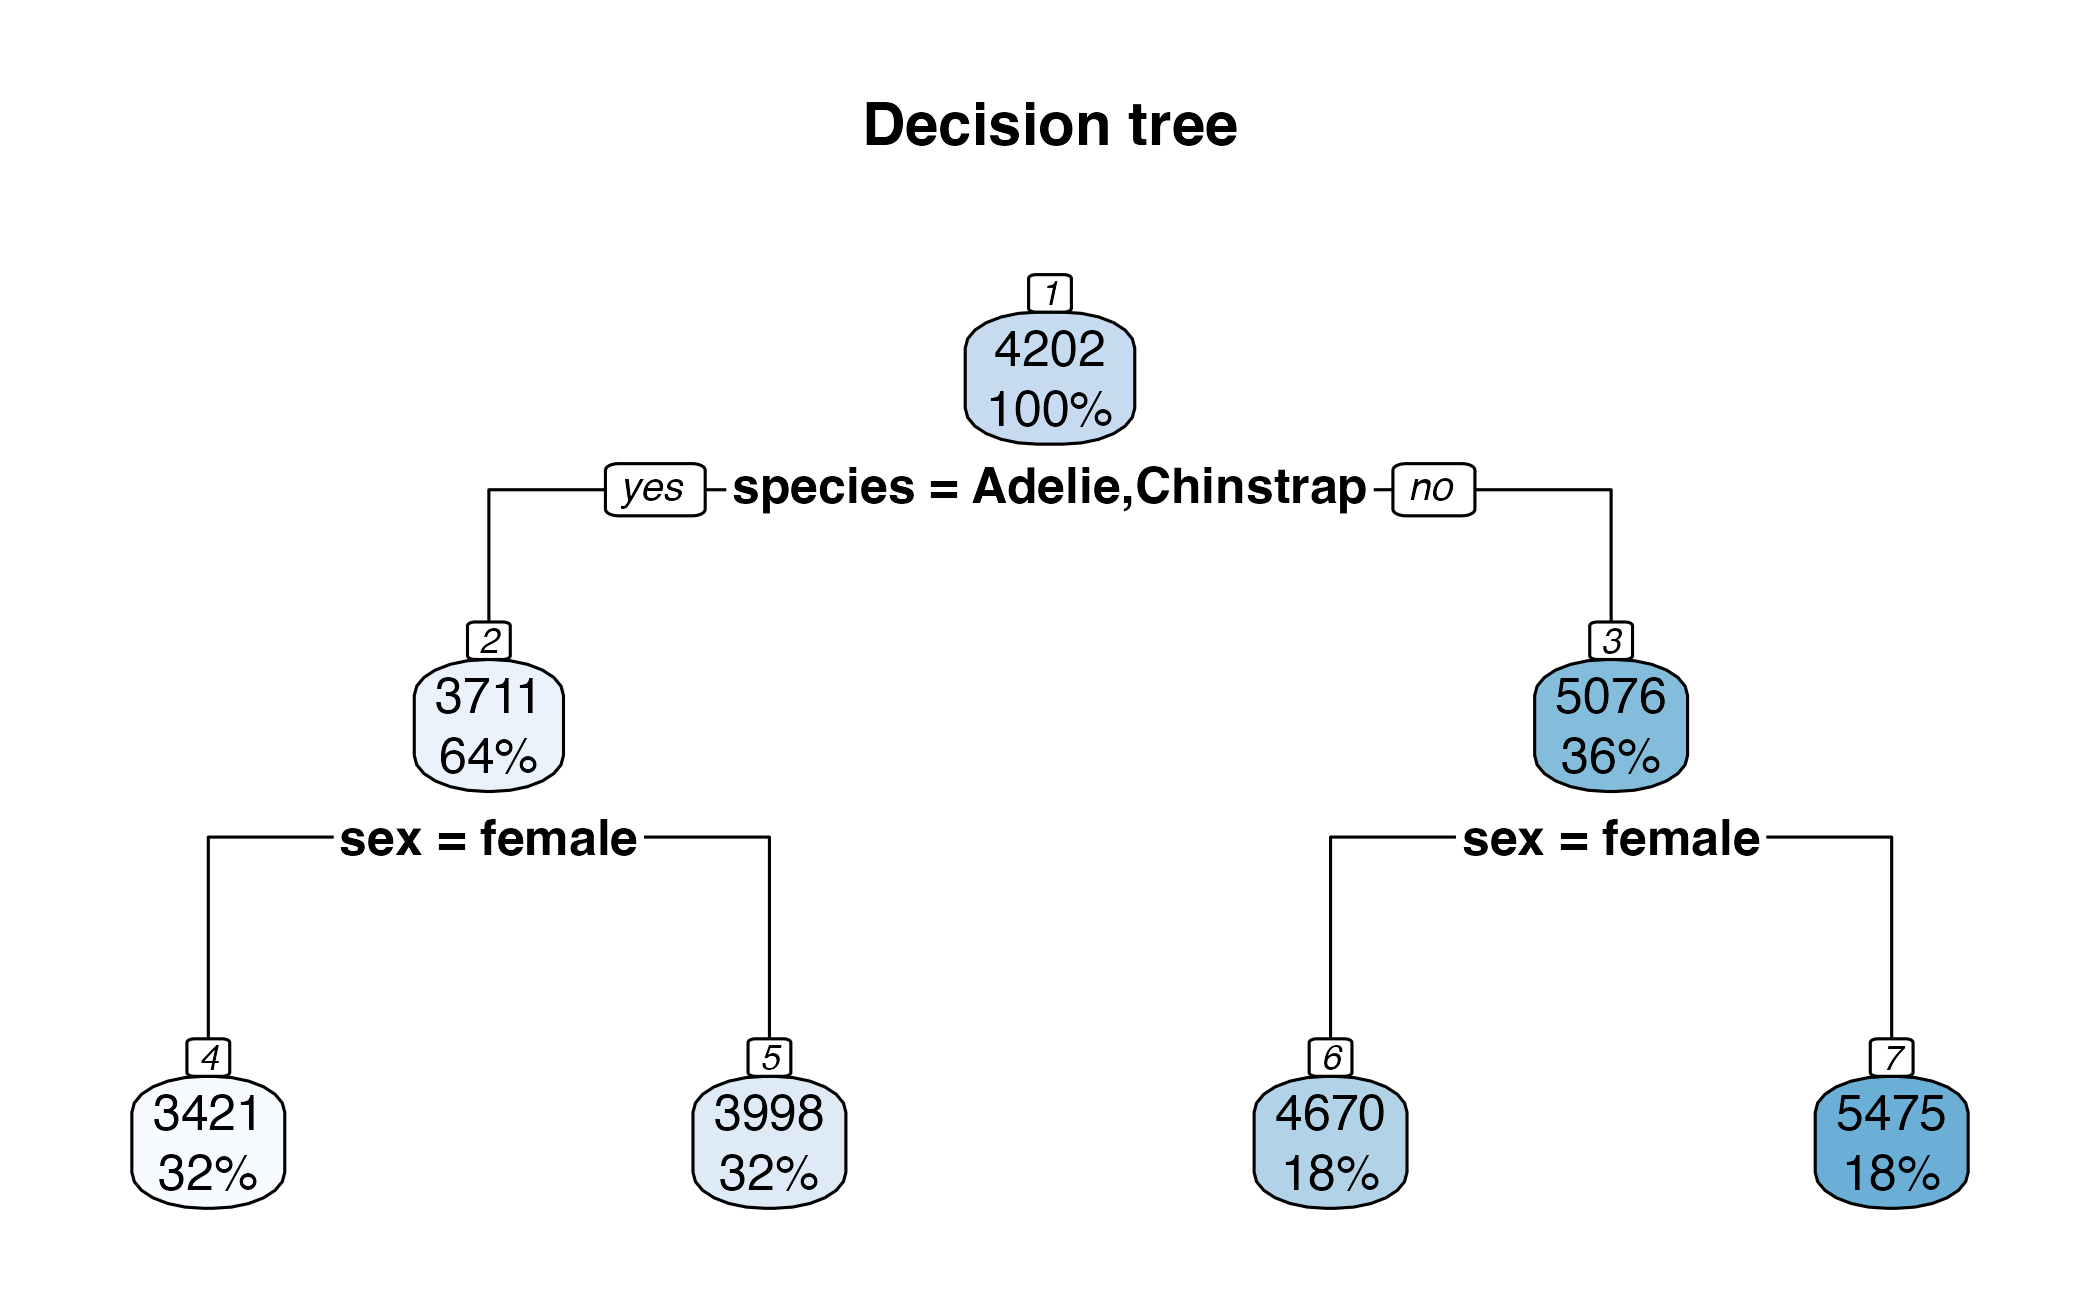
To predict the outcome of a new data point:
- Uses rules learned from splits
- Each split maximizes information gain
Neural network
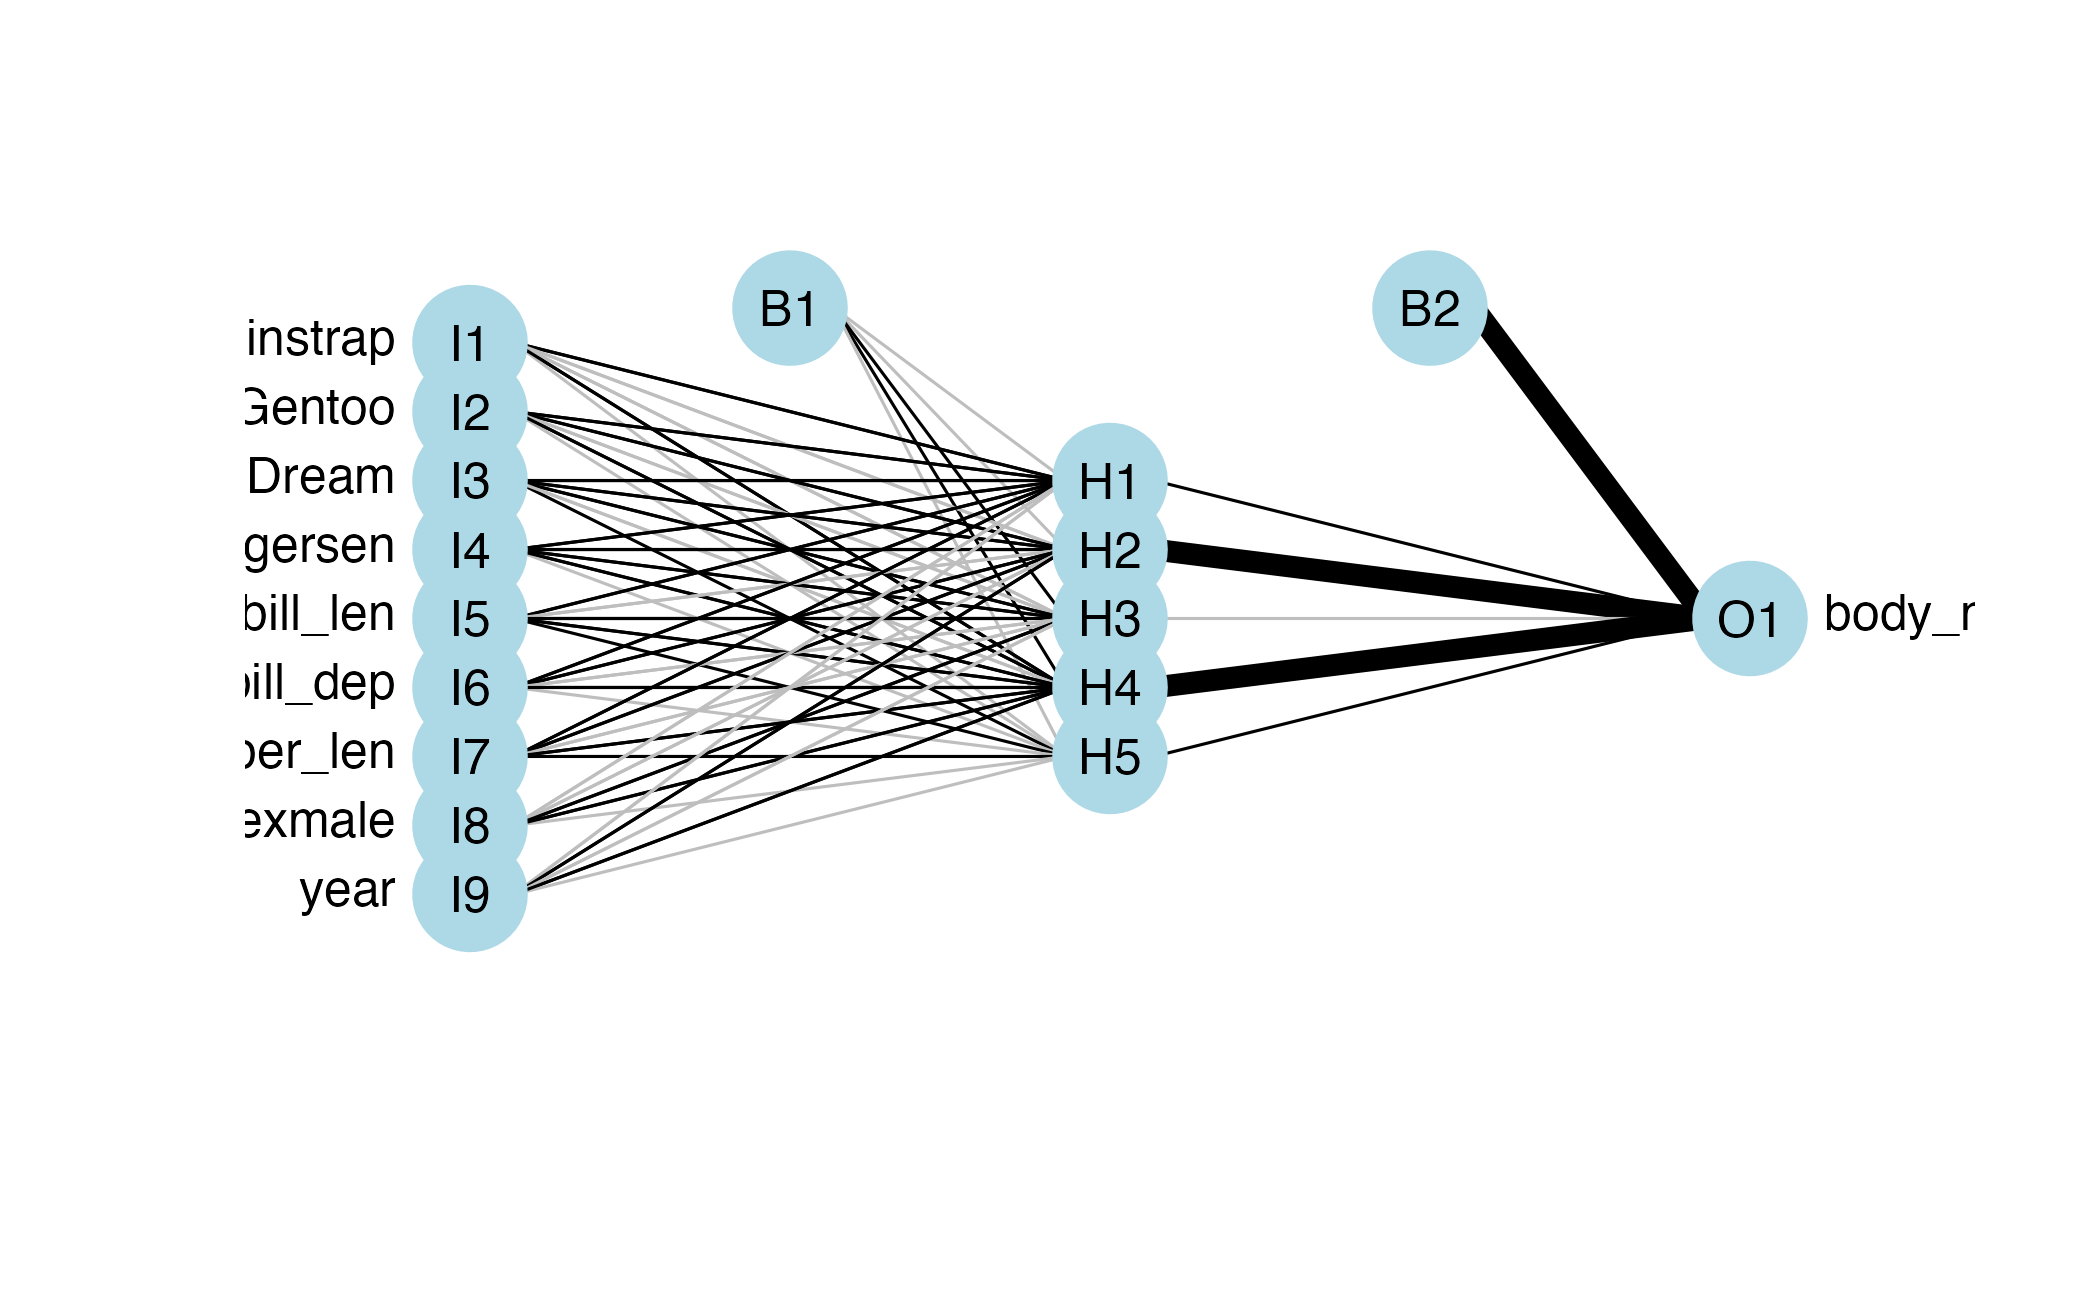
- Pass information forward through layers of interconnected nodes
- Each node applies a transformation (activation function) to the inputs
- Layers are used to identify patterns in the data and make predictions
📝 How do you know if a model is good?
Instructions
With a partner, identify characteristics that make for a “good” predictive model.
04:00

Good is in the eye of the beholder
Quantitative measures of “good”
- Accuracy
- ROC AUC
- Brier score
Qualitative measures of “good”
- How did it make this prediction?
- Is the model equitable across different groups?
- Can I explain the results to a non-technical stakeholder?
Interpretability-complexity trade-off
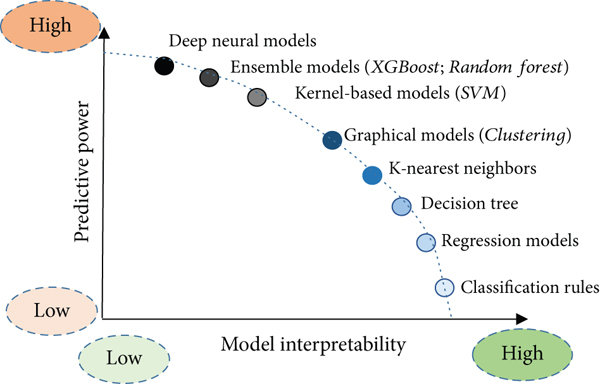
Choosing the desirable qualities for a model
📝 Identify a desirable model
Instructions
With a partner, discuss the following predictive problems and identify what characteristics you would want in a model. Carefully consider the competing desires of the stakeholders.
- Assessing personal property value for tax purposes in Tompkins County, NY
- The Assessor’s Office
- Tax jurisdiction (e.g. City of Ithaca)
- Property owners
- Approving mortgage applications
- Lending institution
- Loan applicants
- Government regulators
12:00
Defining models in R and Python
scikit-learn
- Python library for machine learning
- Almost 20 years old
- Supports classification, regression, clustering, and more
- Feature preprocessing and model evaluation tools
- Directly implements machine learning algorithms
scikit-learn example
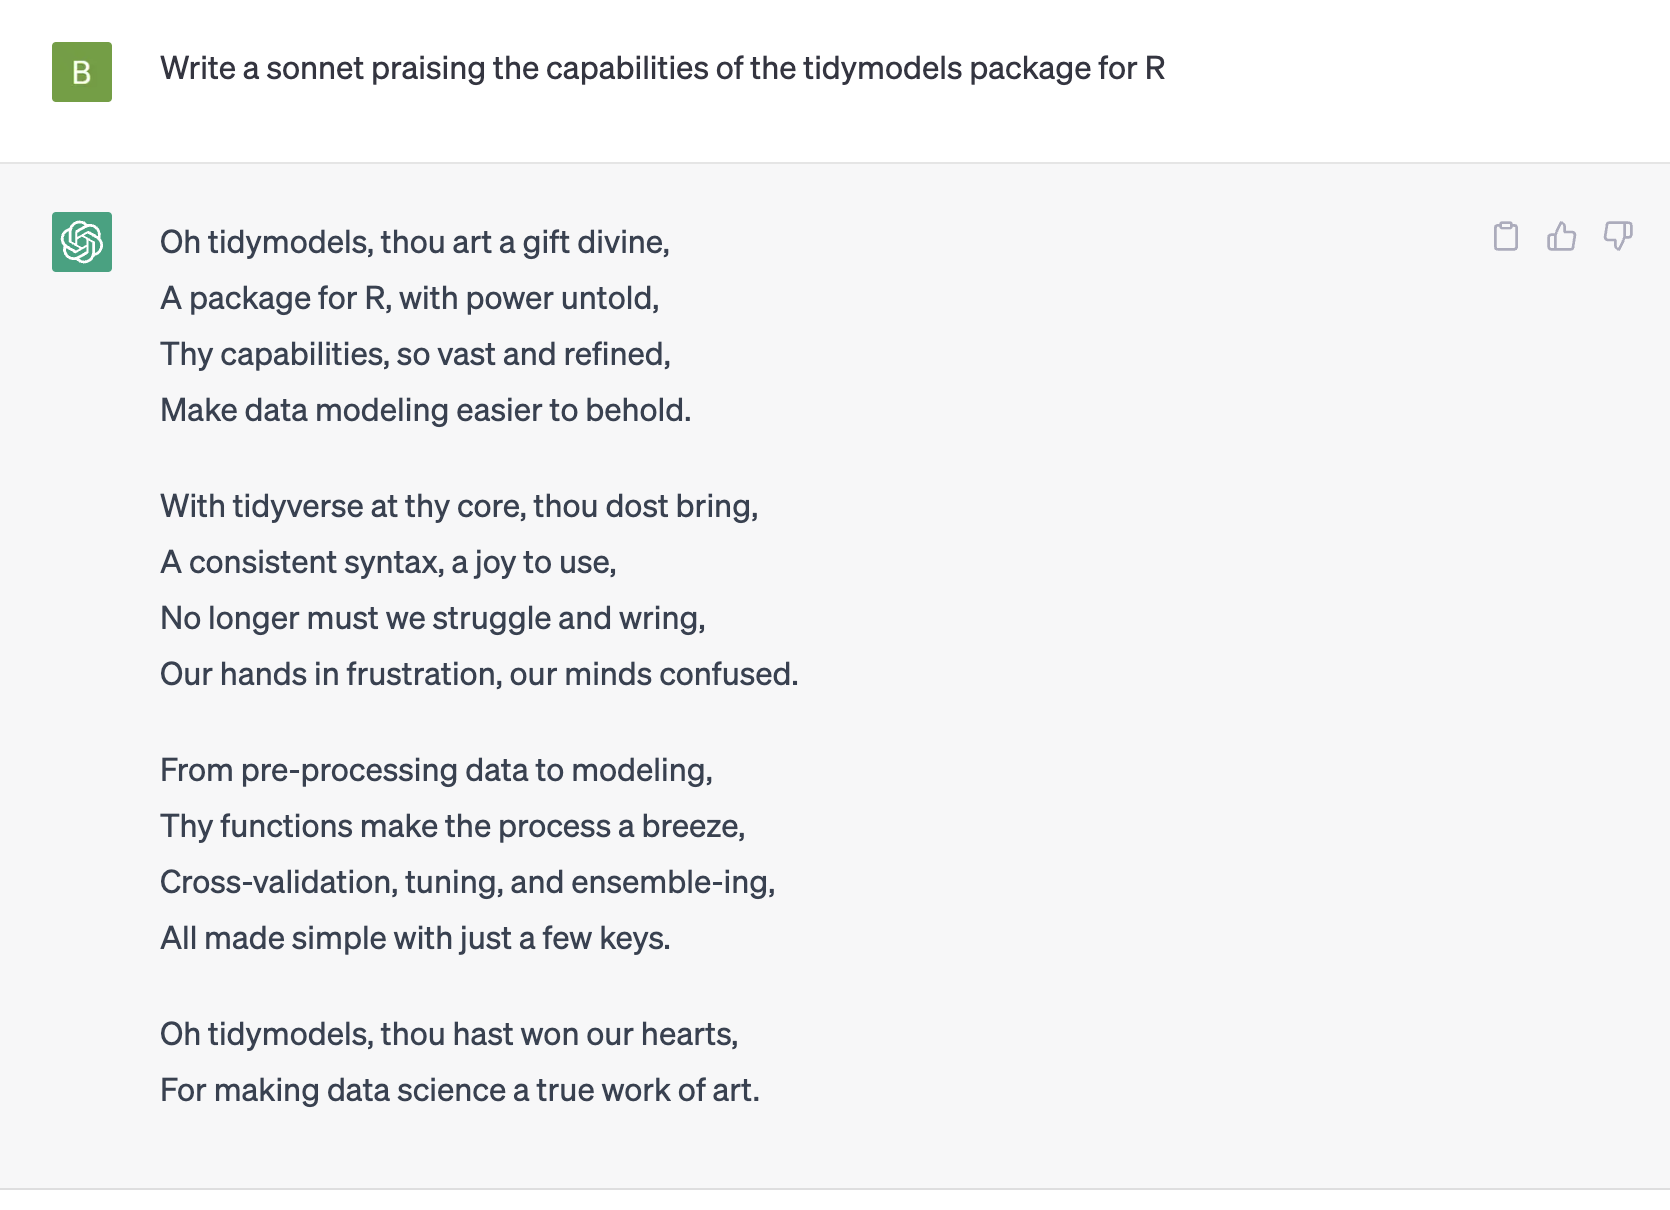
{tidymodels}
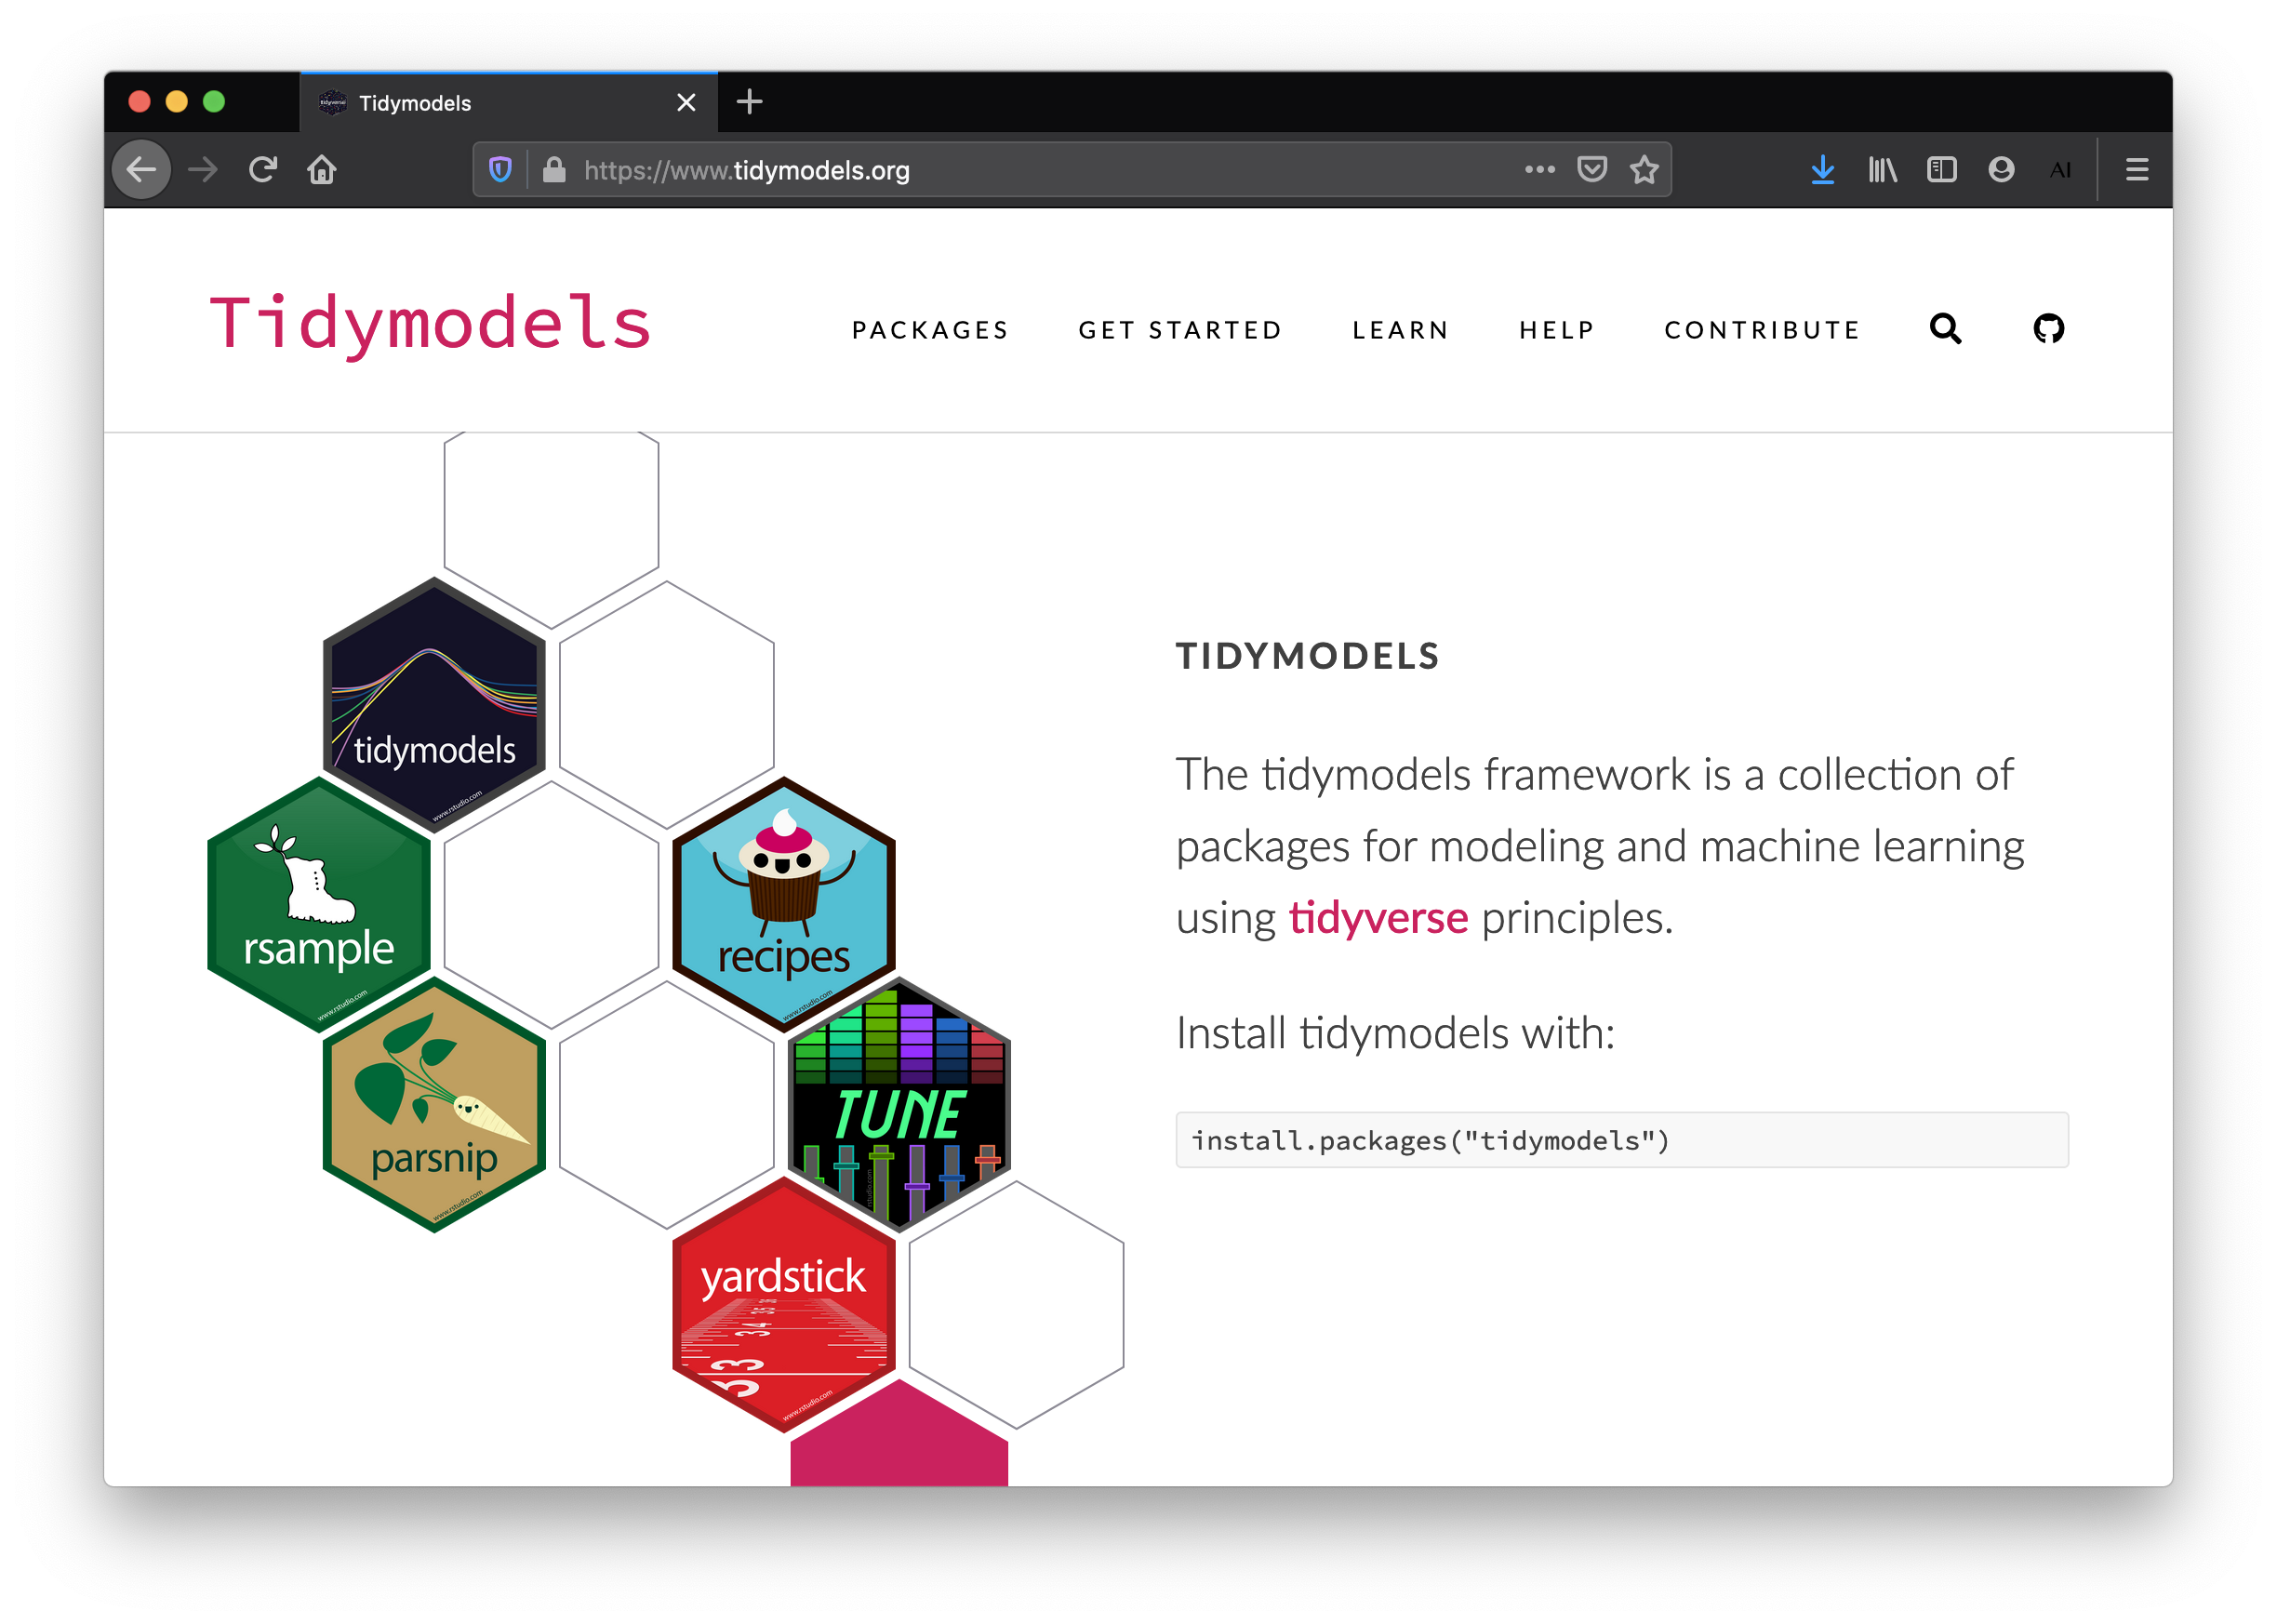
Core {tidymodels} packages
- {parsnip}: a unified interface for creating and using models
- {recipes}: a framework for preprocessing and feature engineering
- {workflows}: a way to bundle models and preprocessing together
- {tune}: tools for hyperparameter tuning
- {rsample}: functions for resampling data sets
- {yardstick}: functions for measuring model performance
- {dials}: tools for creating and managing tuning parameters
{tidymodels} example
Alternative ML ecosystems
Quarto
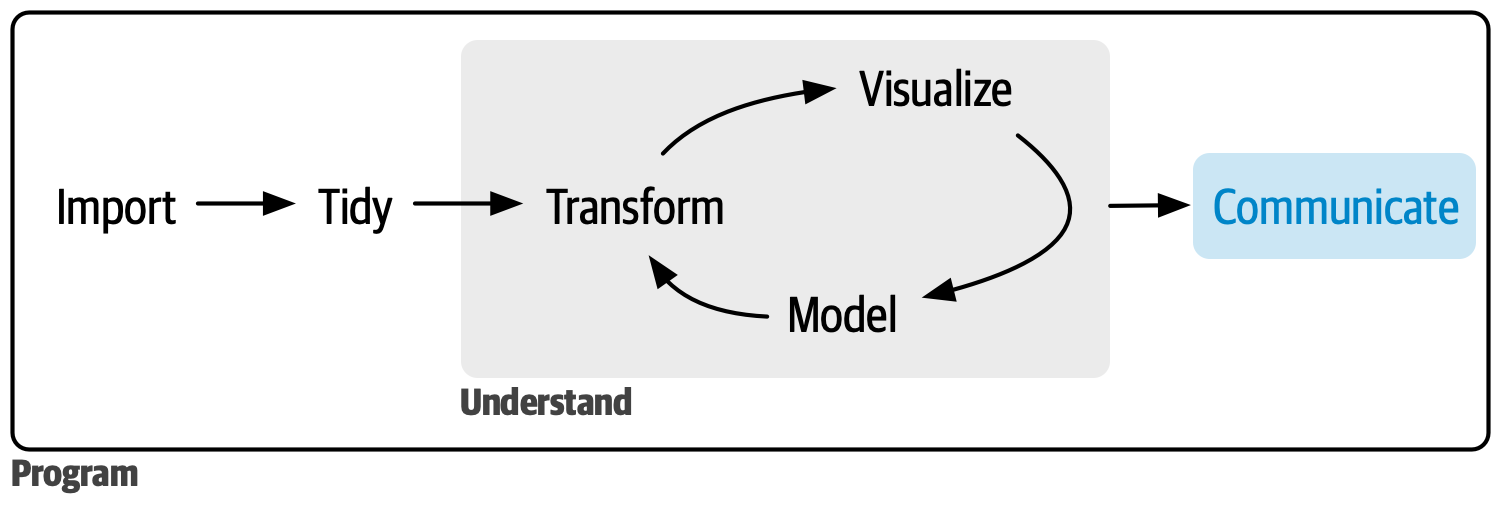
Image credit: R4DS
Major components
- A YAML header surrounded by
---s - Cells of code surounded by
``` - Text mixed with simple text formatting using the Markdown syntax
Rendering process
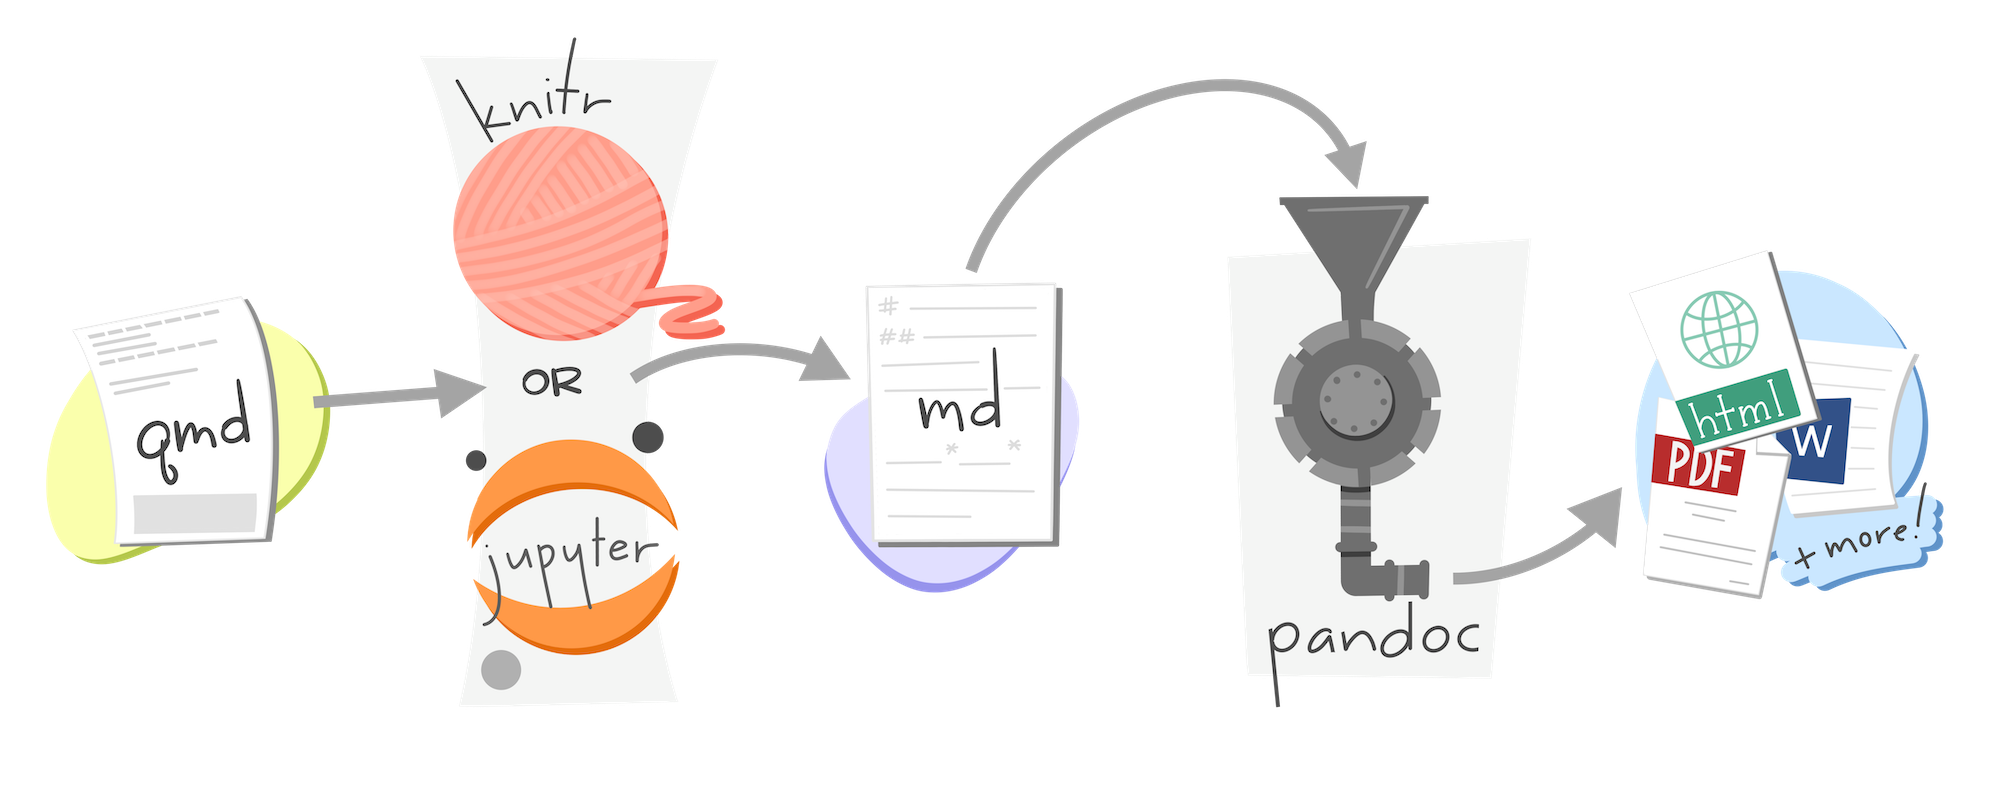
Image credit: Allison Horst
Rendering process
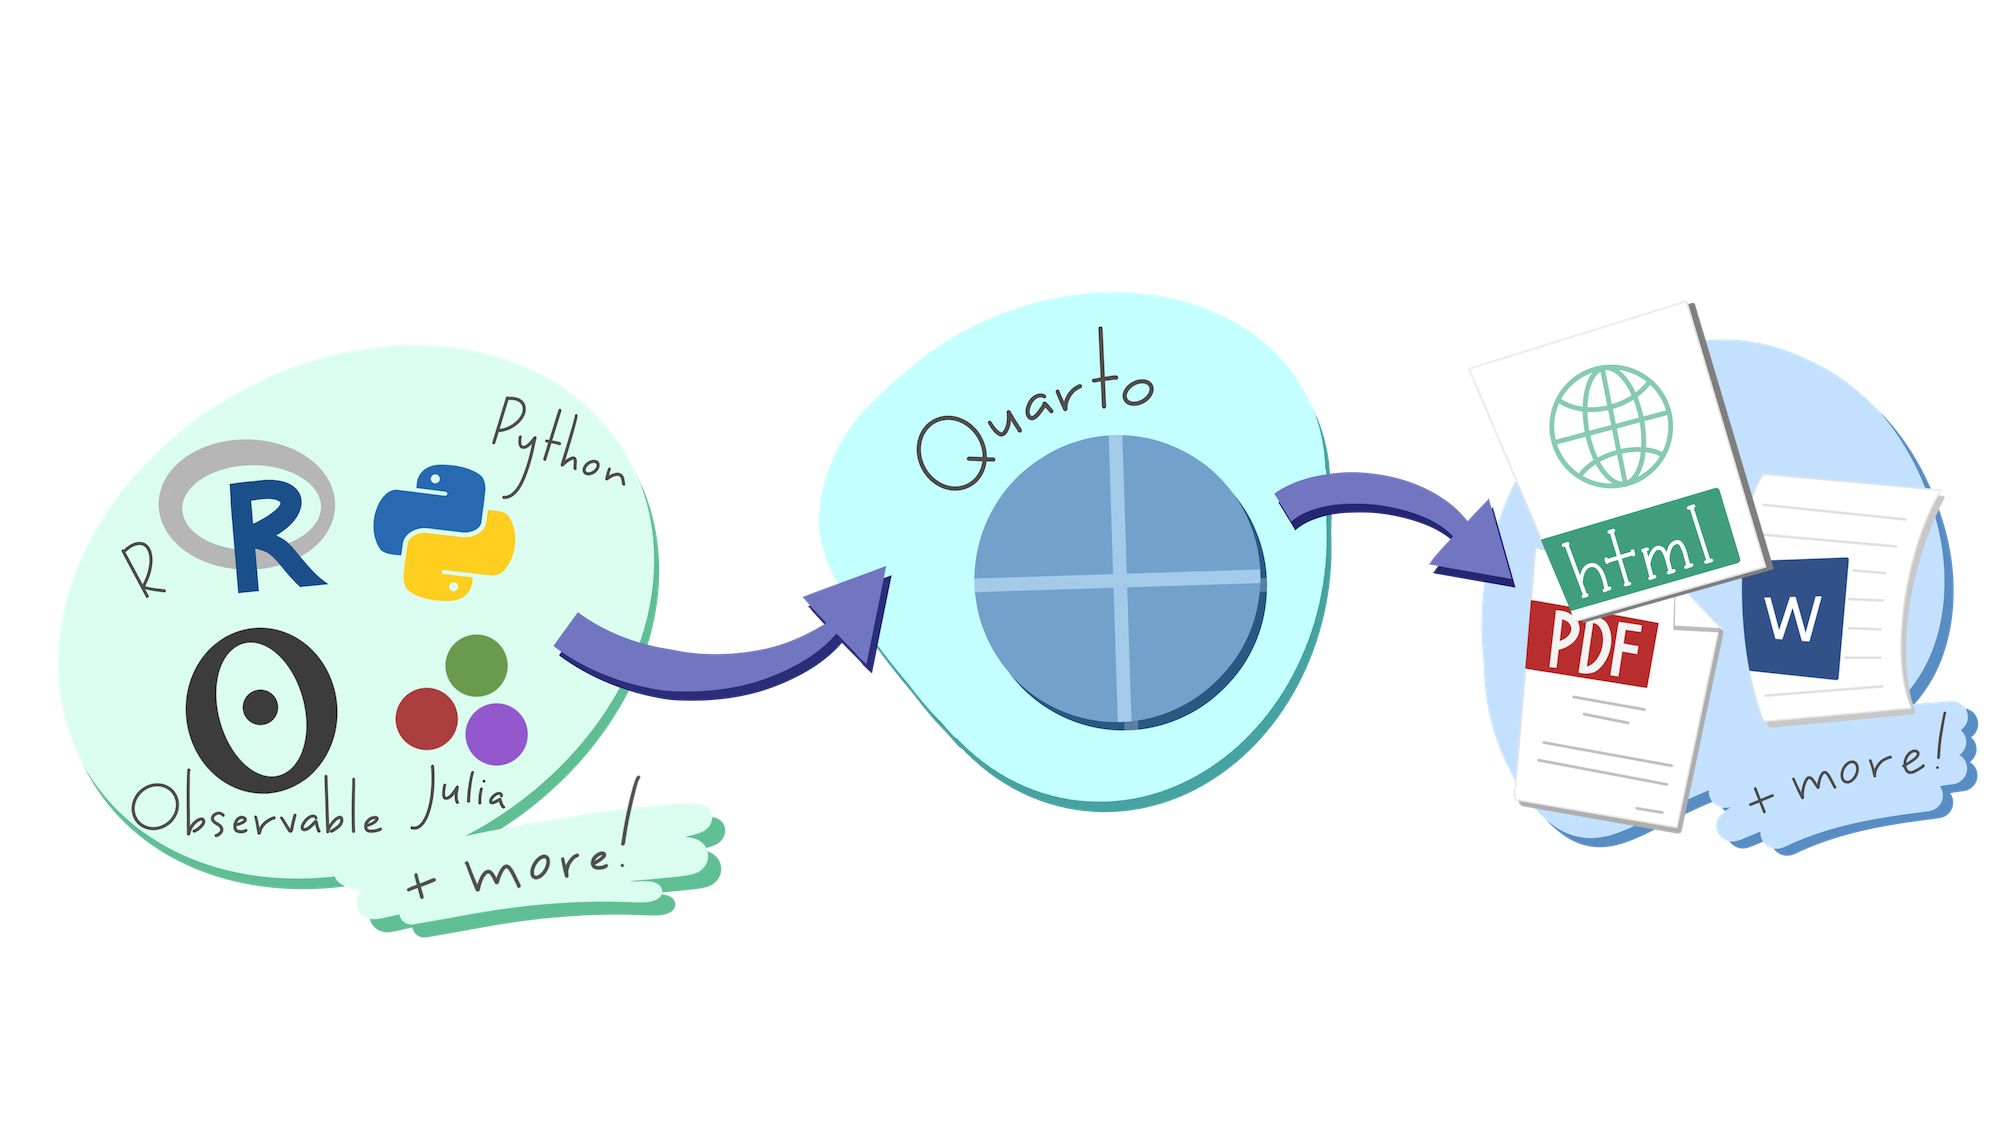
Image credit: Allison Horst
⌨️ Render a Quarto document
Instructions
Follow along with the demo and continue working on hw-00.
Wrap-up
Recap
- Machine learning is a set of tools for building predictive models
- There are many different types of models with different strengths and weaknesses
- Model choice depends on the problem and stakeholders
scikit-learnand {tidymodels} are two popular ecosystems for defining models in Python and R, respectively- Quarto is a powerful tool for authoring documents that combine code and text