Rows: 344
Columns: 8
$ species     <fct> Adelie, Adelie, Adelie, Adelie, Adelie, Adelie, Adelie, Adelie, Adelie, Adelie…
$ island      <fct> Torgersen, Torgersen, Torgersen, Torgersen, Torgersen, Torgersen, Torgersen, T…
$ bill_len    <dbl> 39.1, 39.5, 40.3, NA, 36.7, 39.3, 38.9, 39.2, 34.1, 42.0, 37.8, 37.8, 41.1, 38…
$ bill_dep    <dbl> 18.7, 17.4, 18.0, NA, 19.3, 20.6, 17.8, 19.6, 18.1, 20.2, 17.1, 17.3, 17.6, 21…
$ flipper_len <int> 181, 186, 195, NA, 193, 190, 181, 195, 193, 190, 186, 180, 182, 191, 198, 185,…
$ body_mass   <int> 3750, 3800, 3250, NA, 3450, 3650, 3625, 4675, 3475, 4250, 3300, 3700, 3200, 38…
$ sex         <fct> male, female, female, NA, female, male, female, male, NA, NA, NA, NA, female, …
$ year <int> 2007, 2007, 2007, 2007, 2007, 2007, 2007, 2007, 2007, 2007, 2007, 2007, 2007, …Use your data
Lecture 4
Dr. Benjamin Soltoff
Cornell University
INFO 4940/5940 - Fall 2025
September 4, 2025
Announcements
Announcements
- Homework 01
Learning objectives
- Motivate the importance of data partitioning in machine learning
- Describe common data partitioning strategies
- Evaluate the potential for information leakage
- Introduce resampling methods for model assessment
- Demonstrate common resampling methods
Why partition data?
Data splitting and spending
For machine learning, we typically split data into training and test sets:
- The training set is used to train/fit a model.
- The test set is used to find an independent assessment of model performance.
Do not 🚫 use the test set during training. But why?
Meet the Palmer penguins
Image credit: @allison_horst
penguins
How might we spend our data?
- Training a model
- Comparing multiple models
- Tuning hyperparameters
- Estimating model performance
- Selecting relevant features
- Exploring the data
Typically our data is finite and limited, so we have to be careful how we spend it.
Simple data partitioning
The holdout method
- Training set: model building and testing
- Test set: final model assessment
How do we split?
Goal is to ensure no meaningful differences between sets
Randomization process to assign observations to sets
How much do we allocate to training vs. testing?
- Depends on the size of the dataset
- Enough observations in training set to learn patterns, but also enough in test set to get a reliable estimate of performance
Simple random sampling
📝 Is simple random sampling appropriate?
Instructions
For each predictive problem, decide whether simple random sampling is appropriate or not. If not, suggest an alternative.
- Medical AI for emergency diagnosis
- Dataset: 50,000 emergency room visits from 3 hospitals (Hospital A: 35,000 cases, Hospital B: 10,000 cases, Hospital C: 5,000 cases)
- Goal: Predict whether patients need immediate surgery based on symptoms and vital signs
- Climate change prediction model
- Dataset: Daily temperature and weather measurements from 1980-2023 across 200 weather stations
- Goal: Predict future temperature trends for the next 5 years
07:00
Information leakage
Model uses information that would not be available at prediction time
Train-test contamination: information from the test set leaks into the training process
- Data preprocessing
- Feature selection
- Time dependency
📝 Preventing information leakage
Instructions
You’re building a model to predict house prices. Your workflow includes:
- Calculating neighborhood average prices as a feature
- Removing outliers (houses > $2M)
- Normalizing all price-related features
- Training a regression model
At what point should you split your data? Identify potential sources of information leakage and explain how your timing prevents them.
03:00
Using the training set
We should not use the test set until the very end of the analysis.
We also should not use the same observations to both train and evaluate the model.
So how do we use the training set to estimate a model and evaluate its performance without biasing our results?
Resampling methods
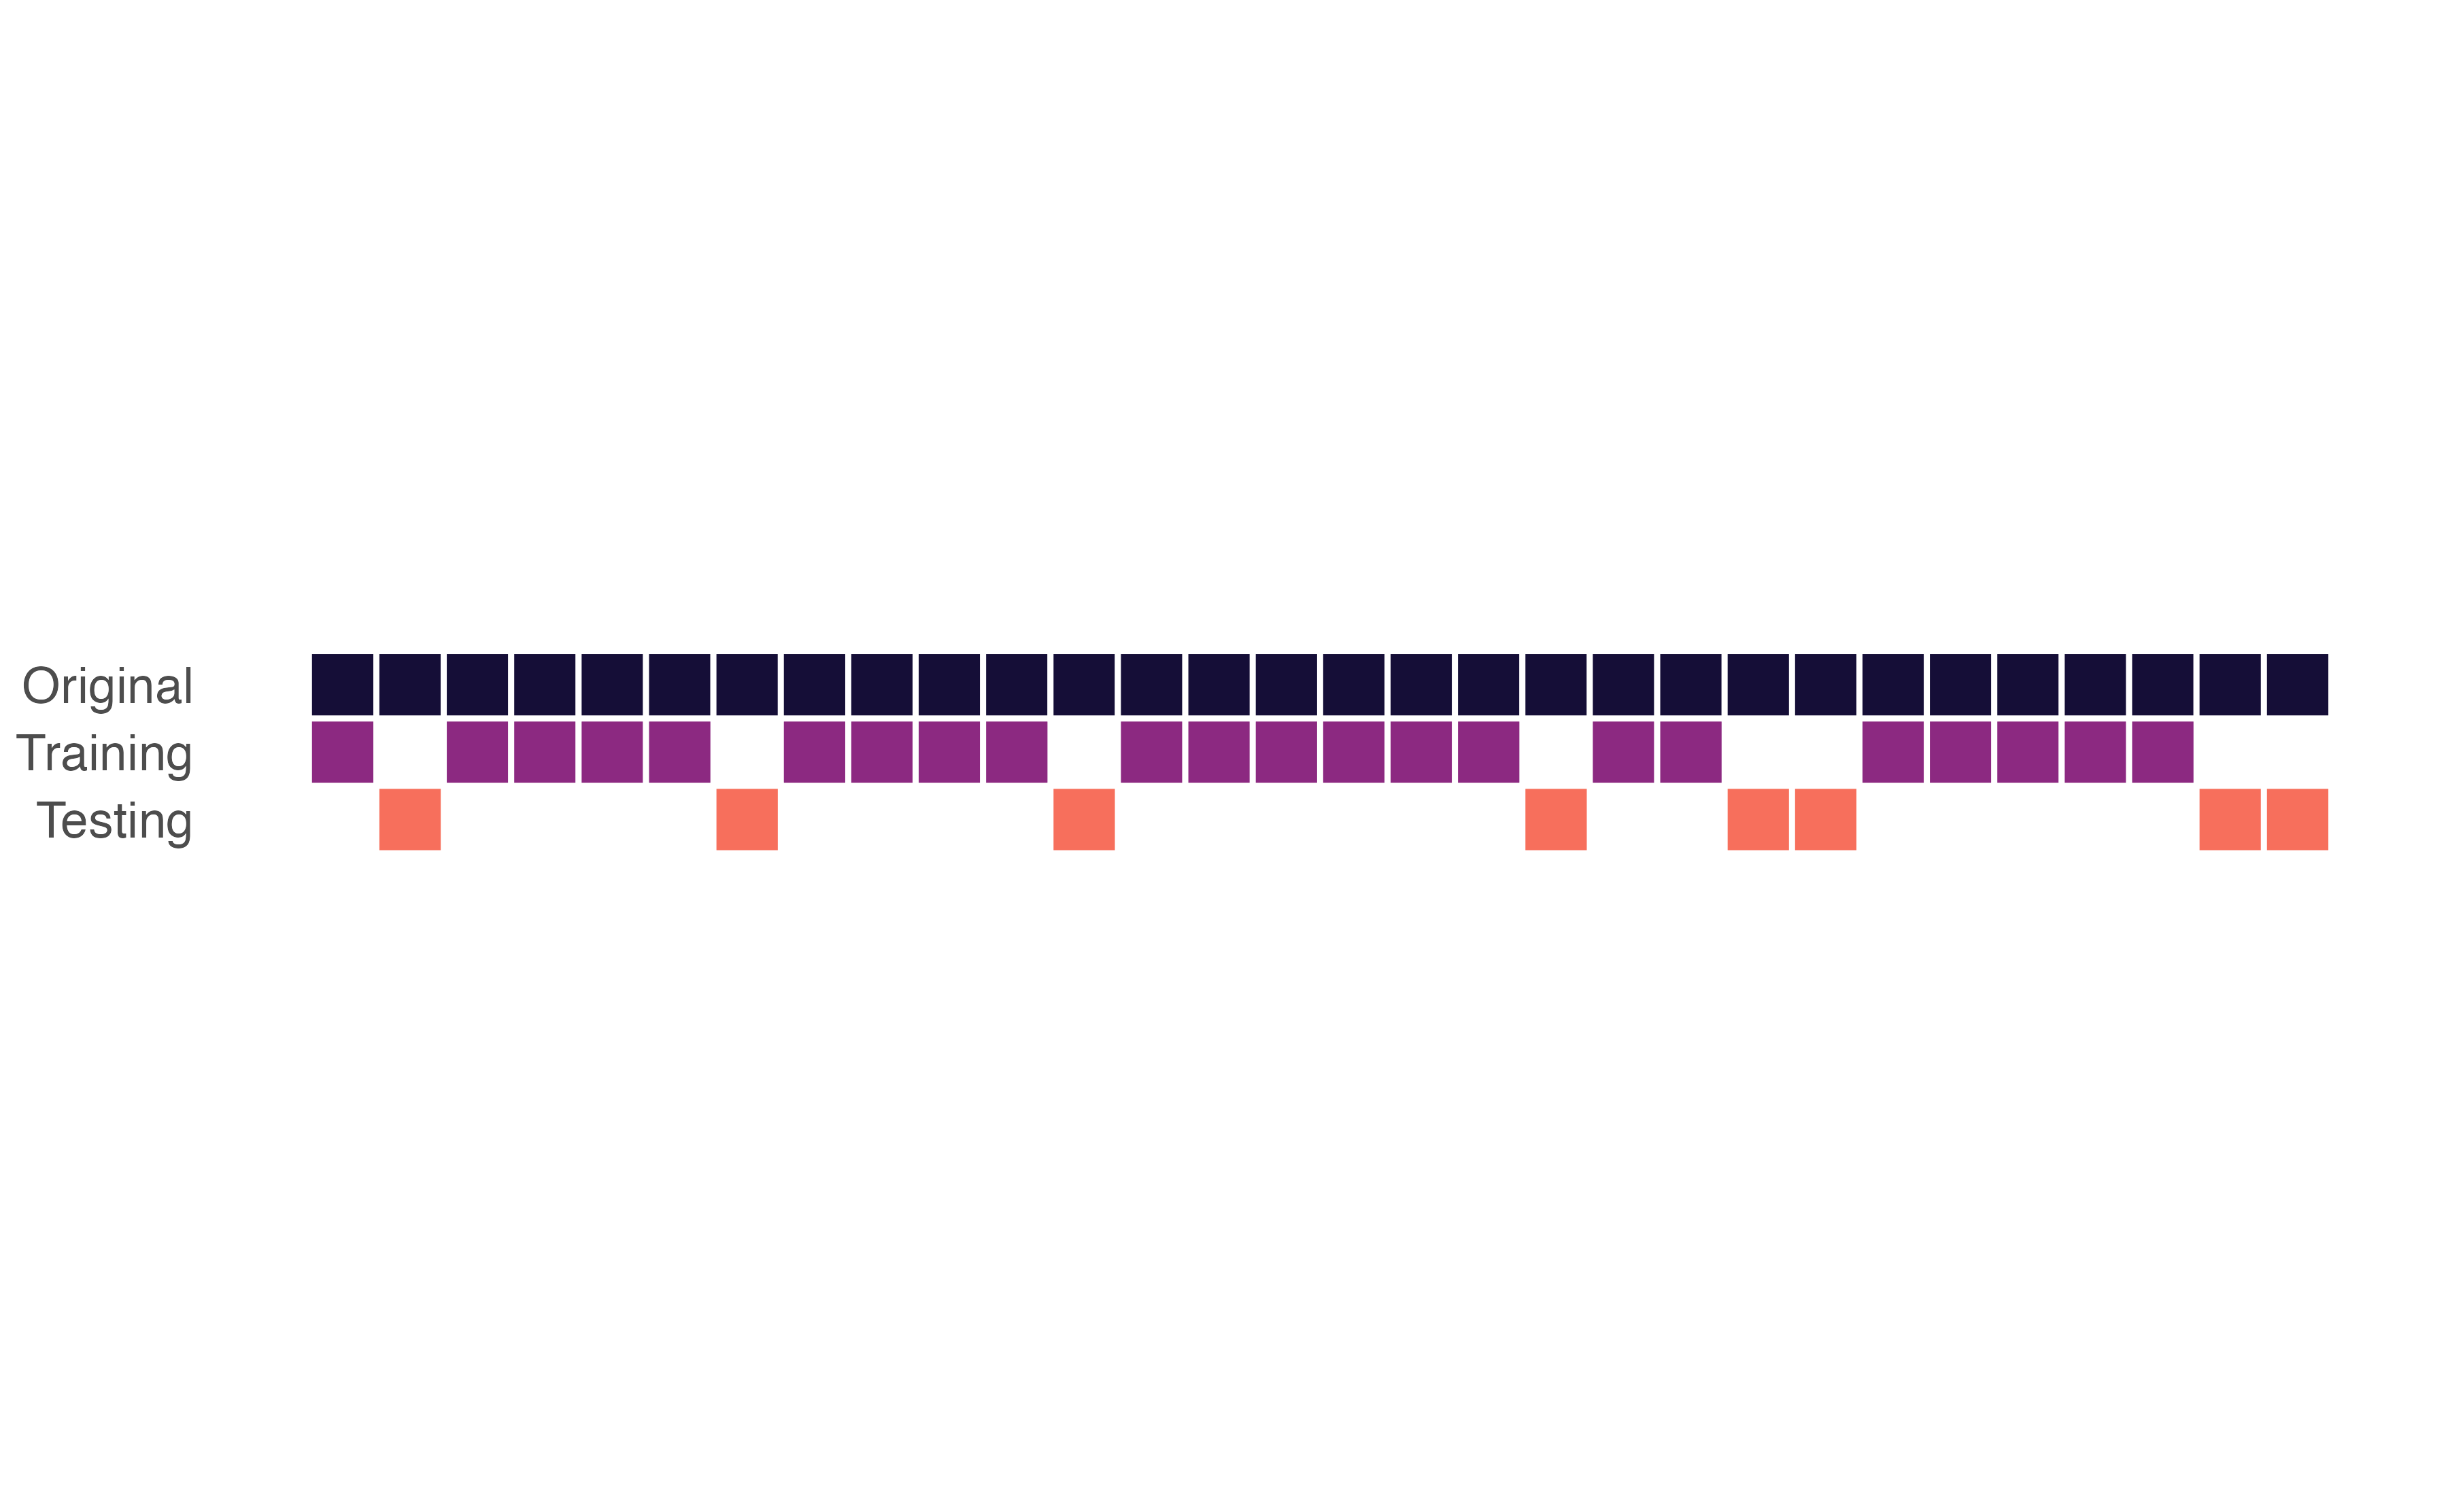
Data Splitting


Resampling methods
\(V\)-fold cross-validation
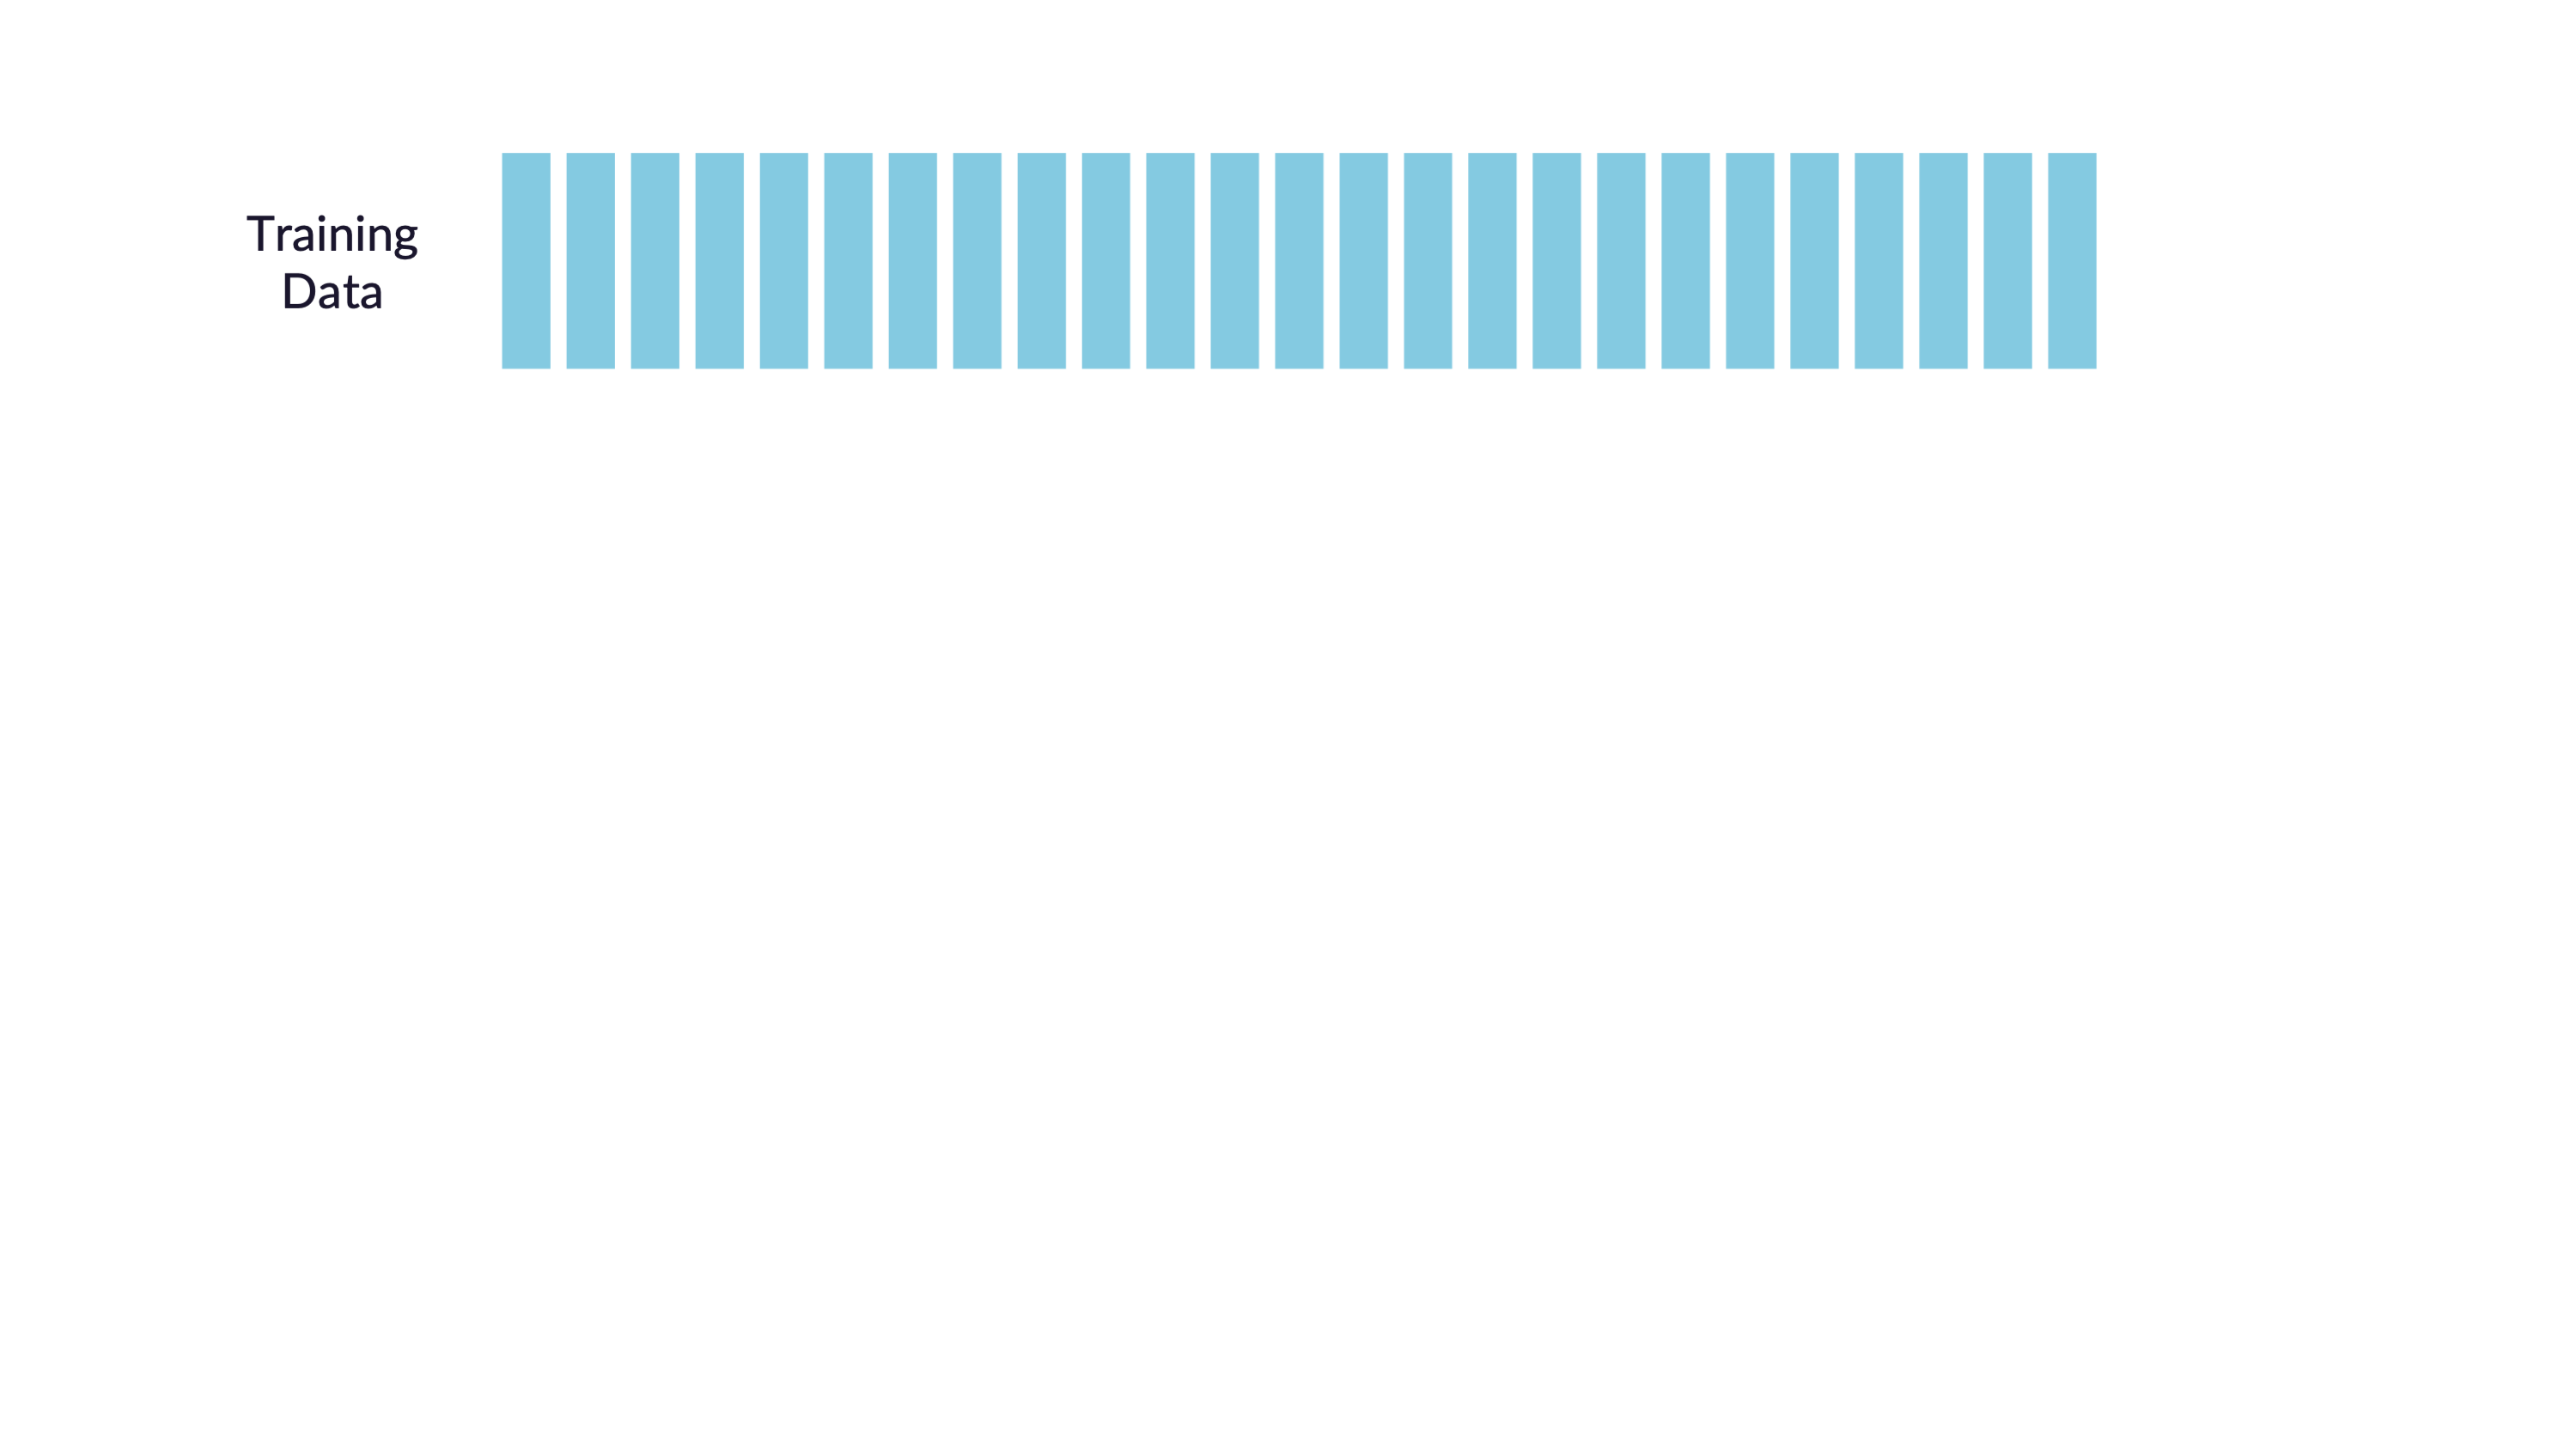
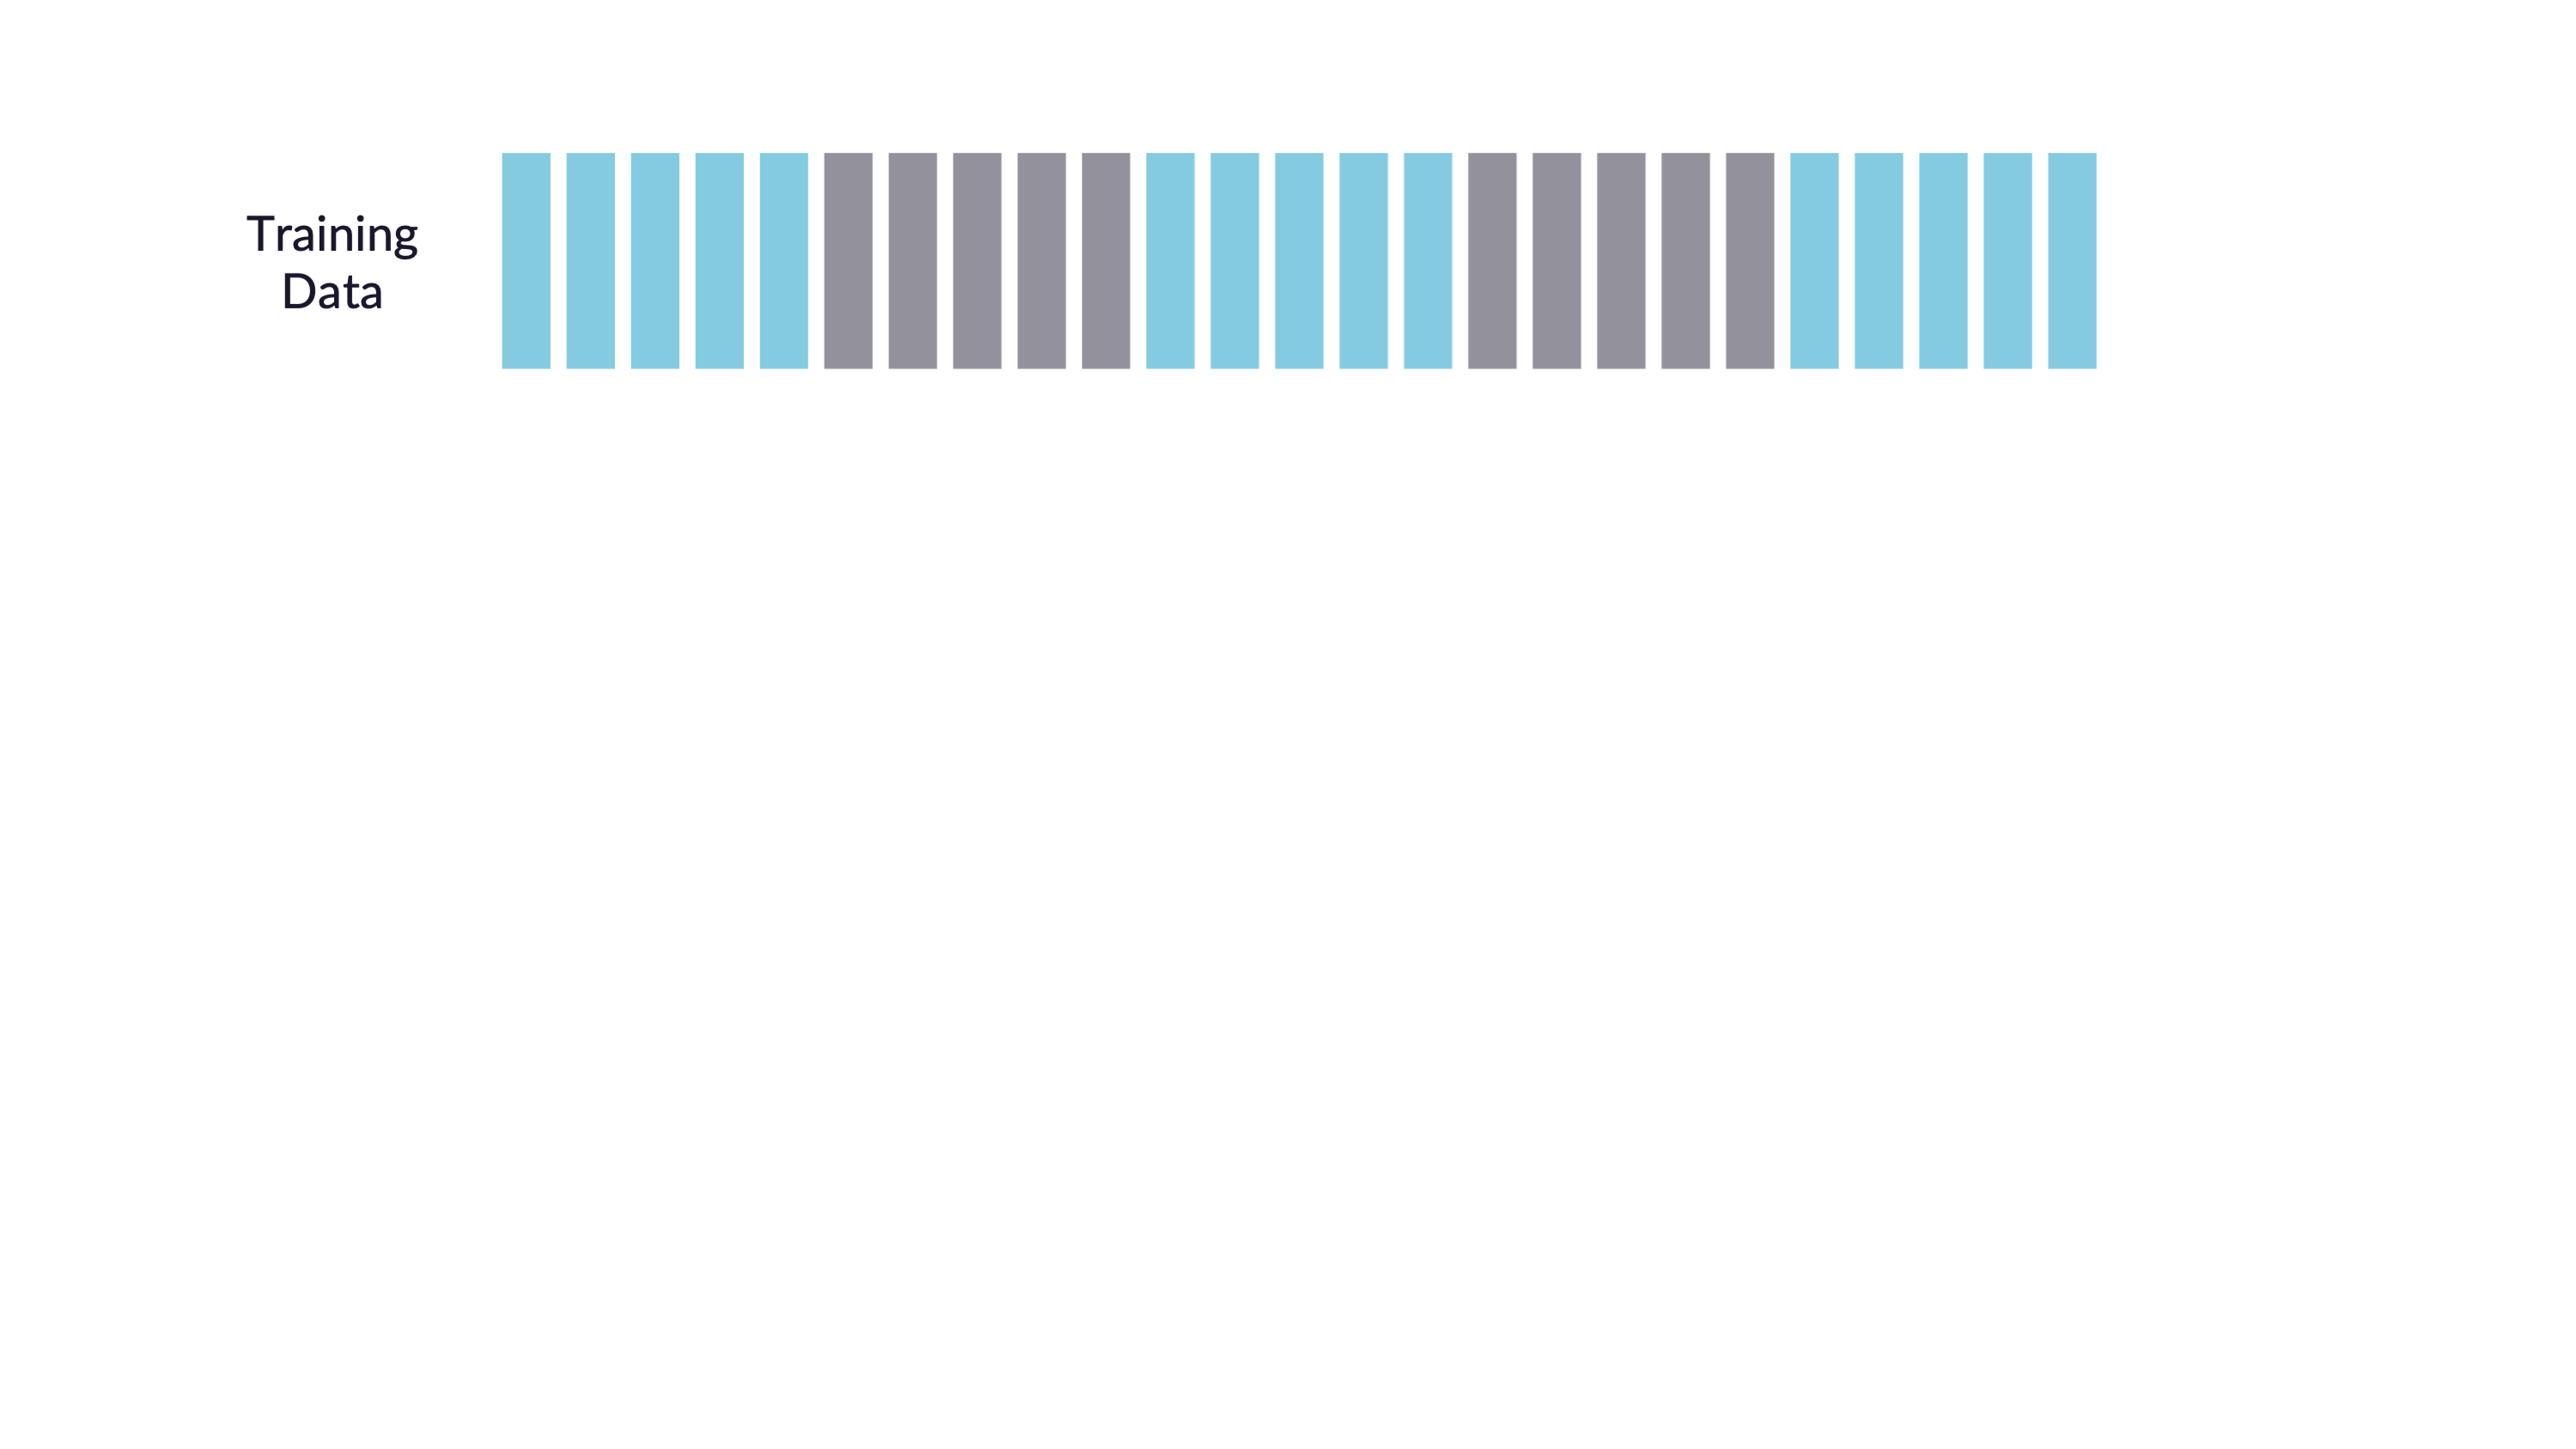
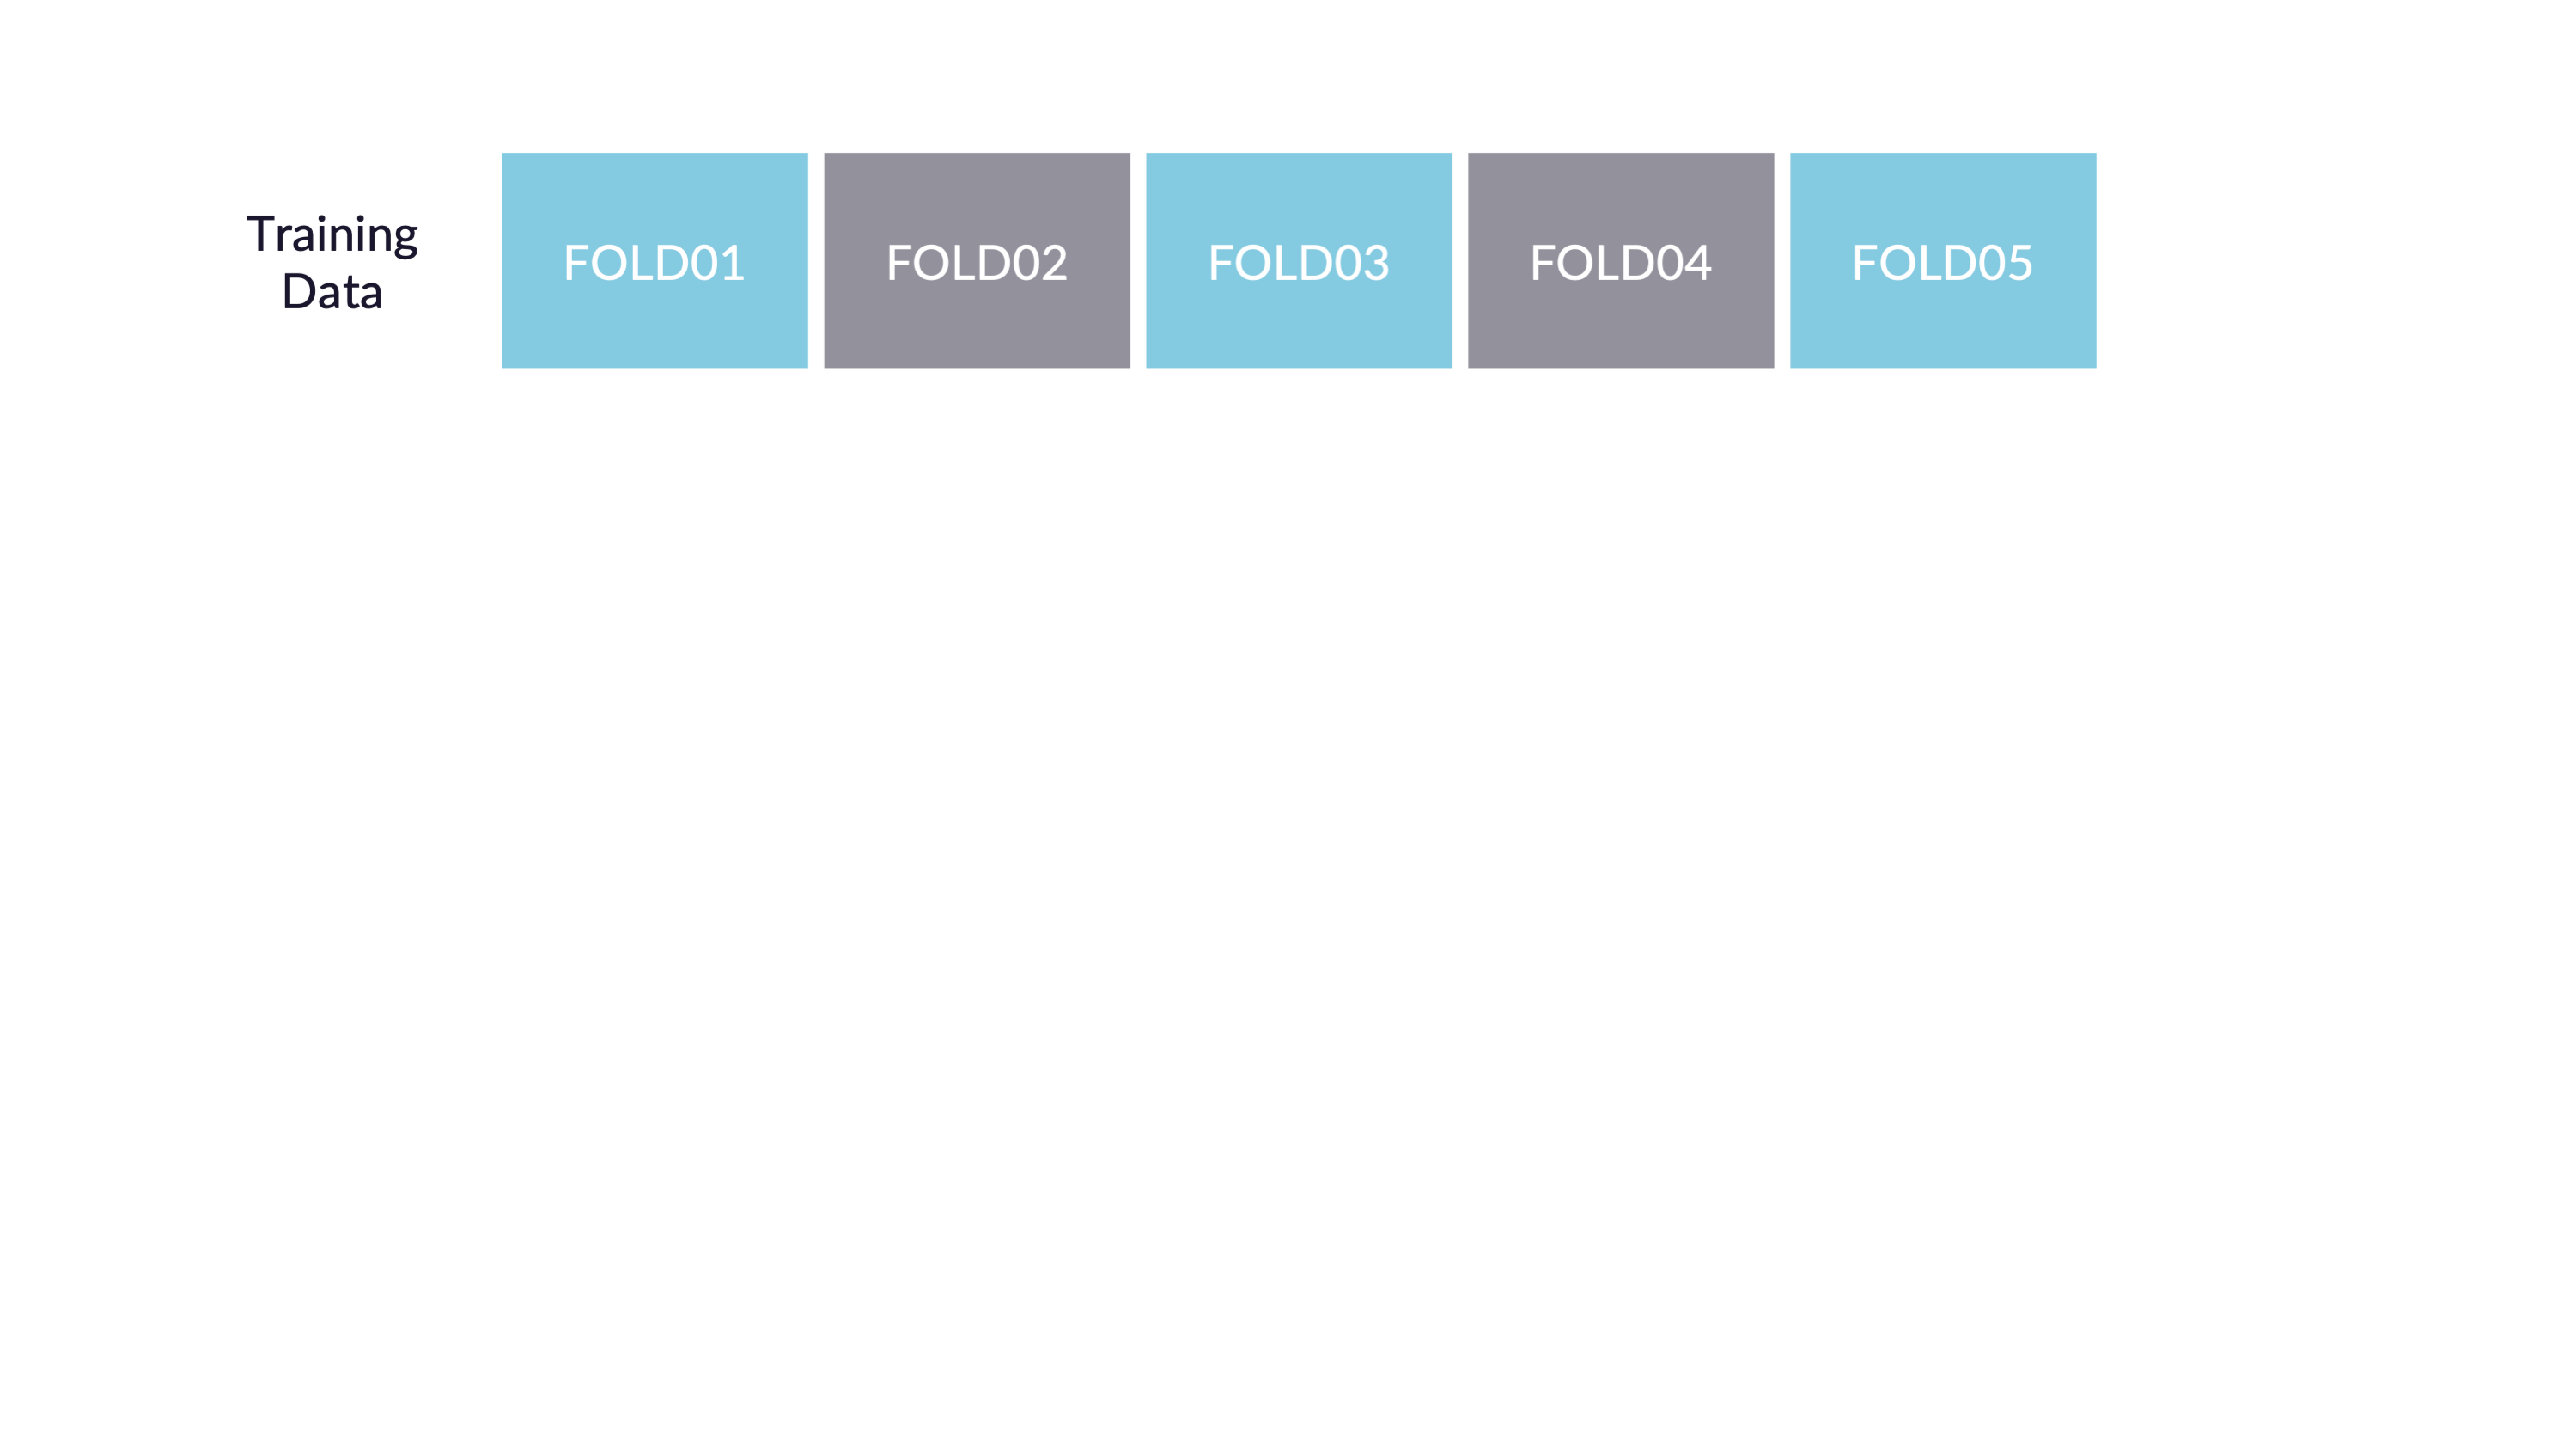
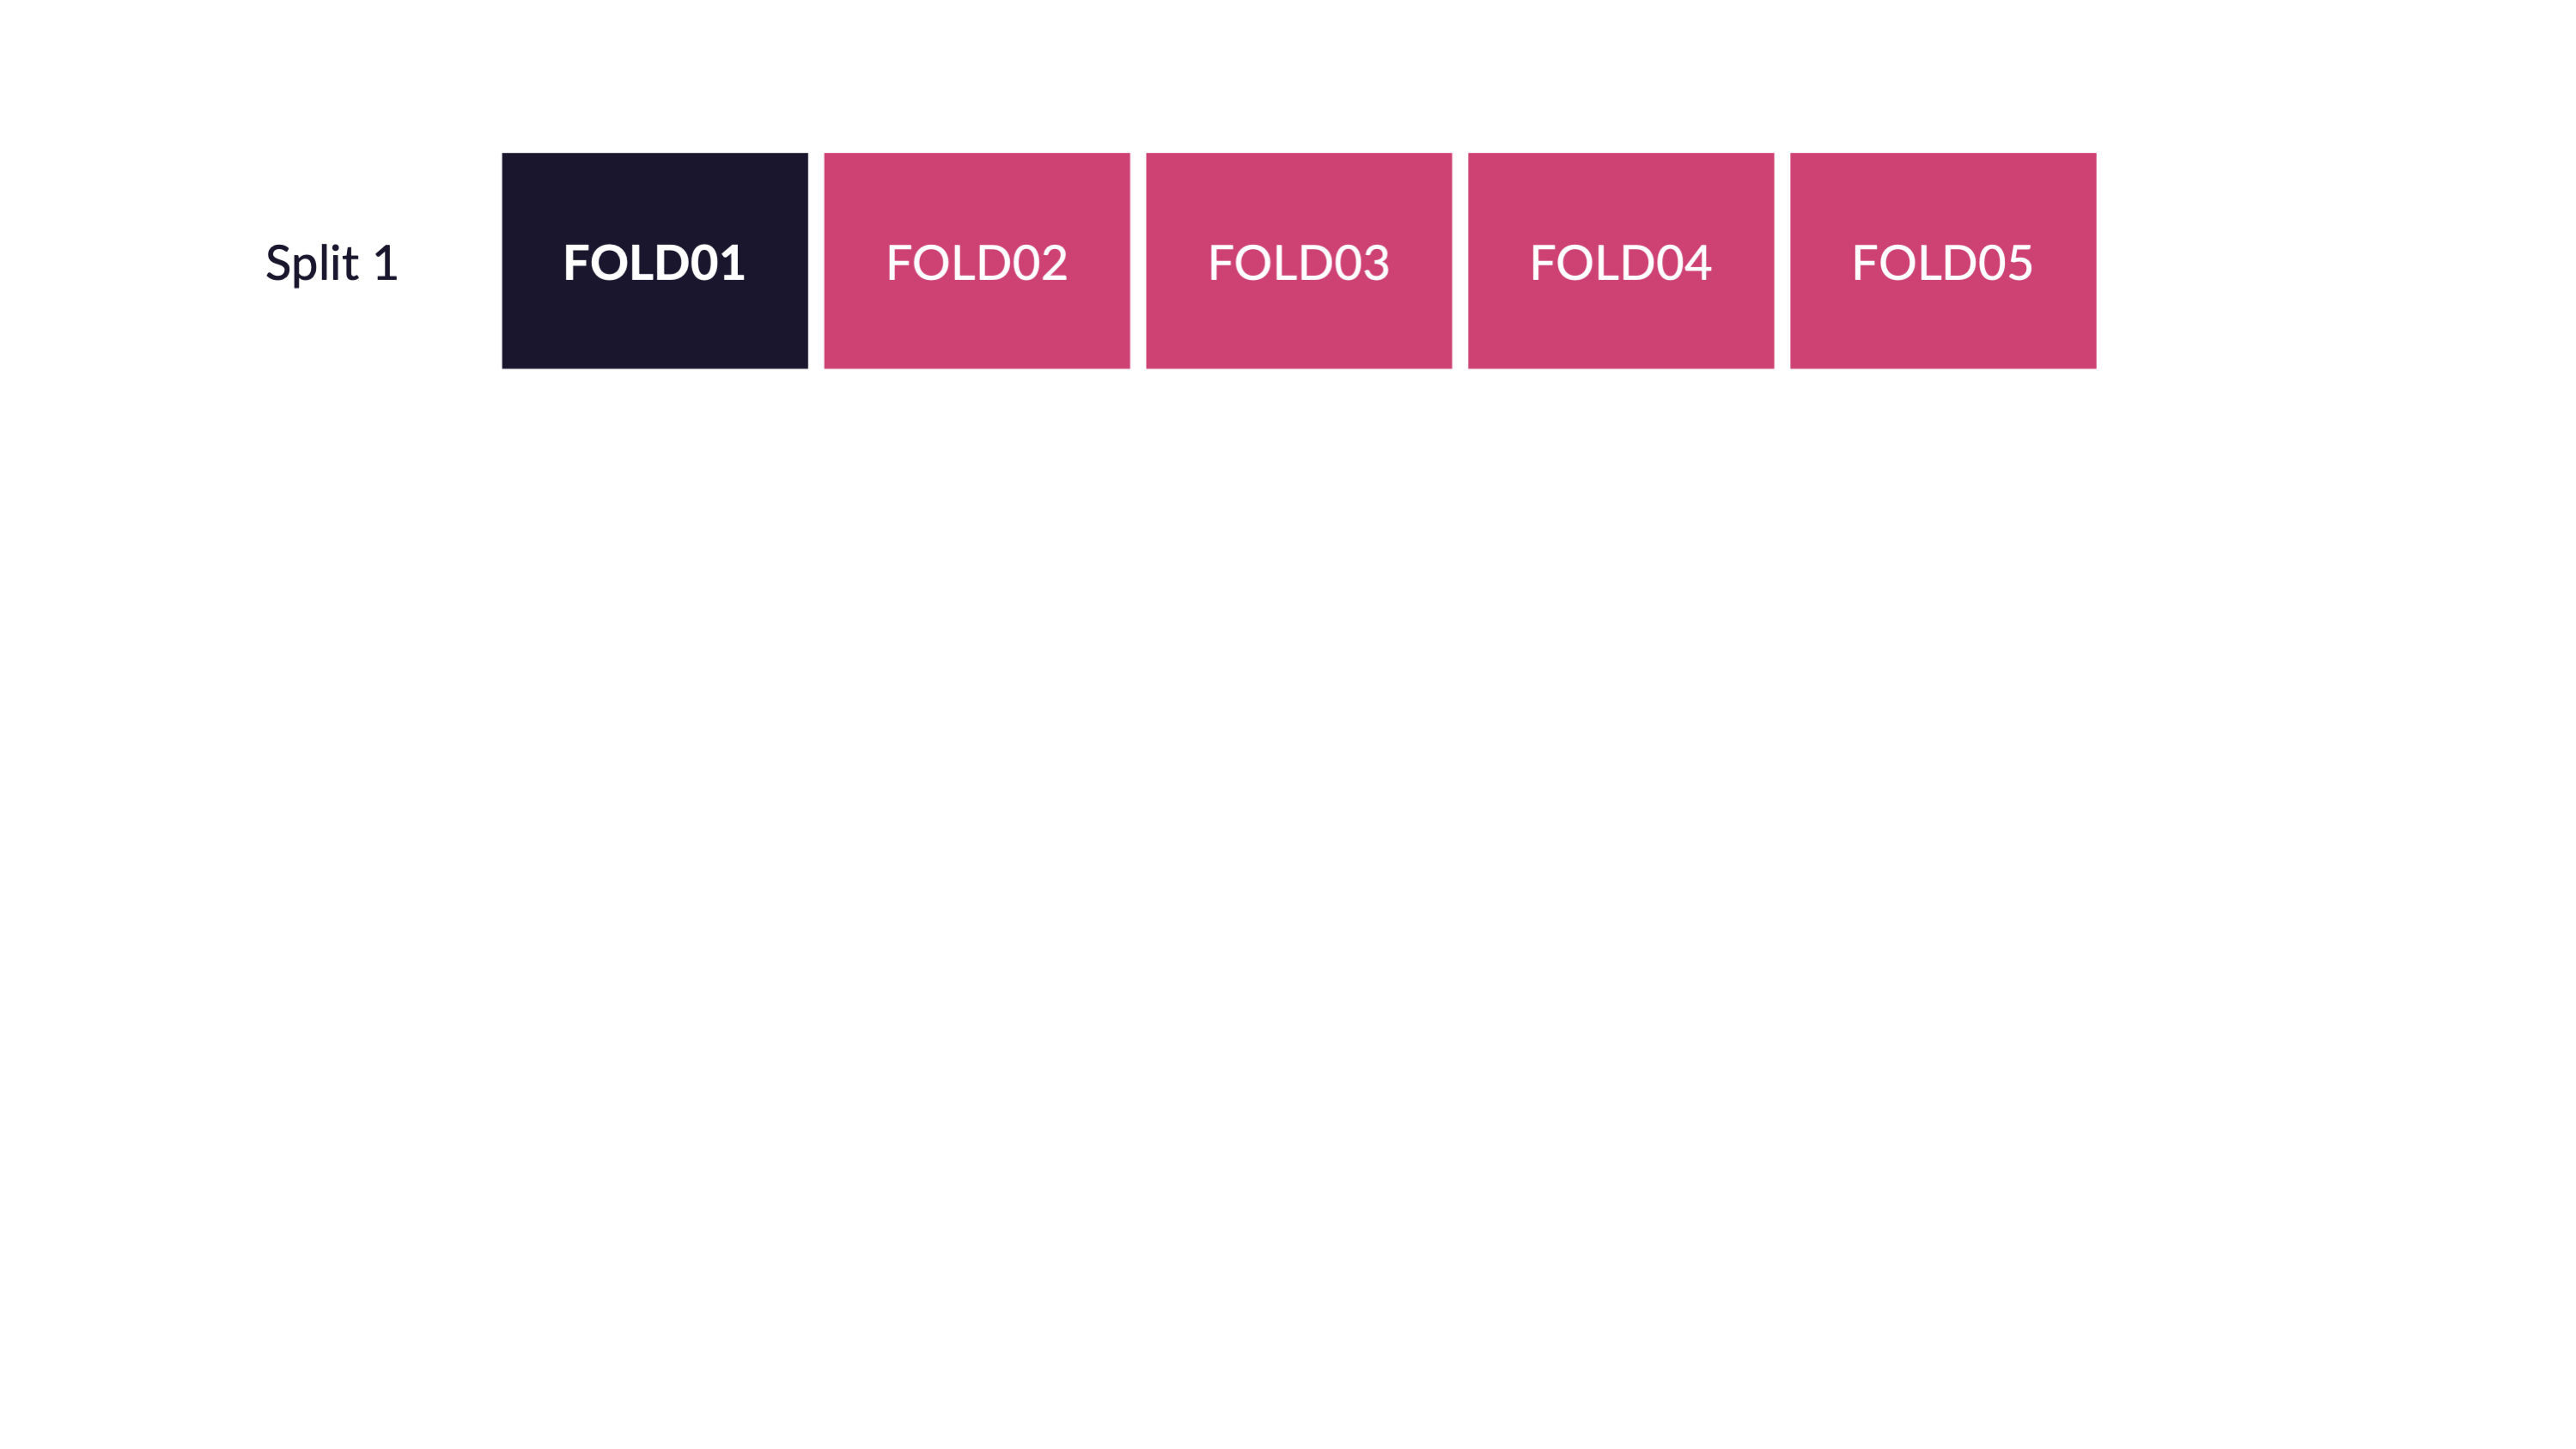
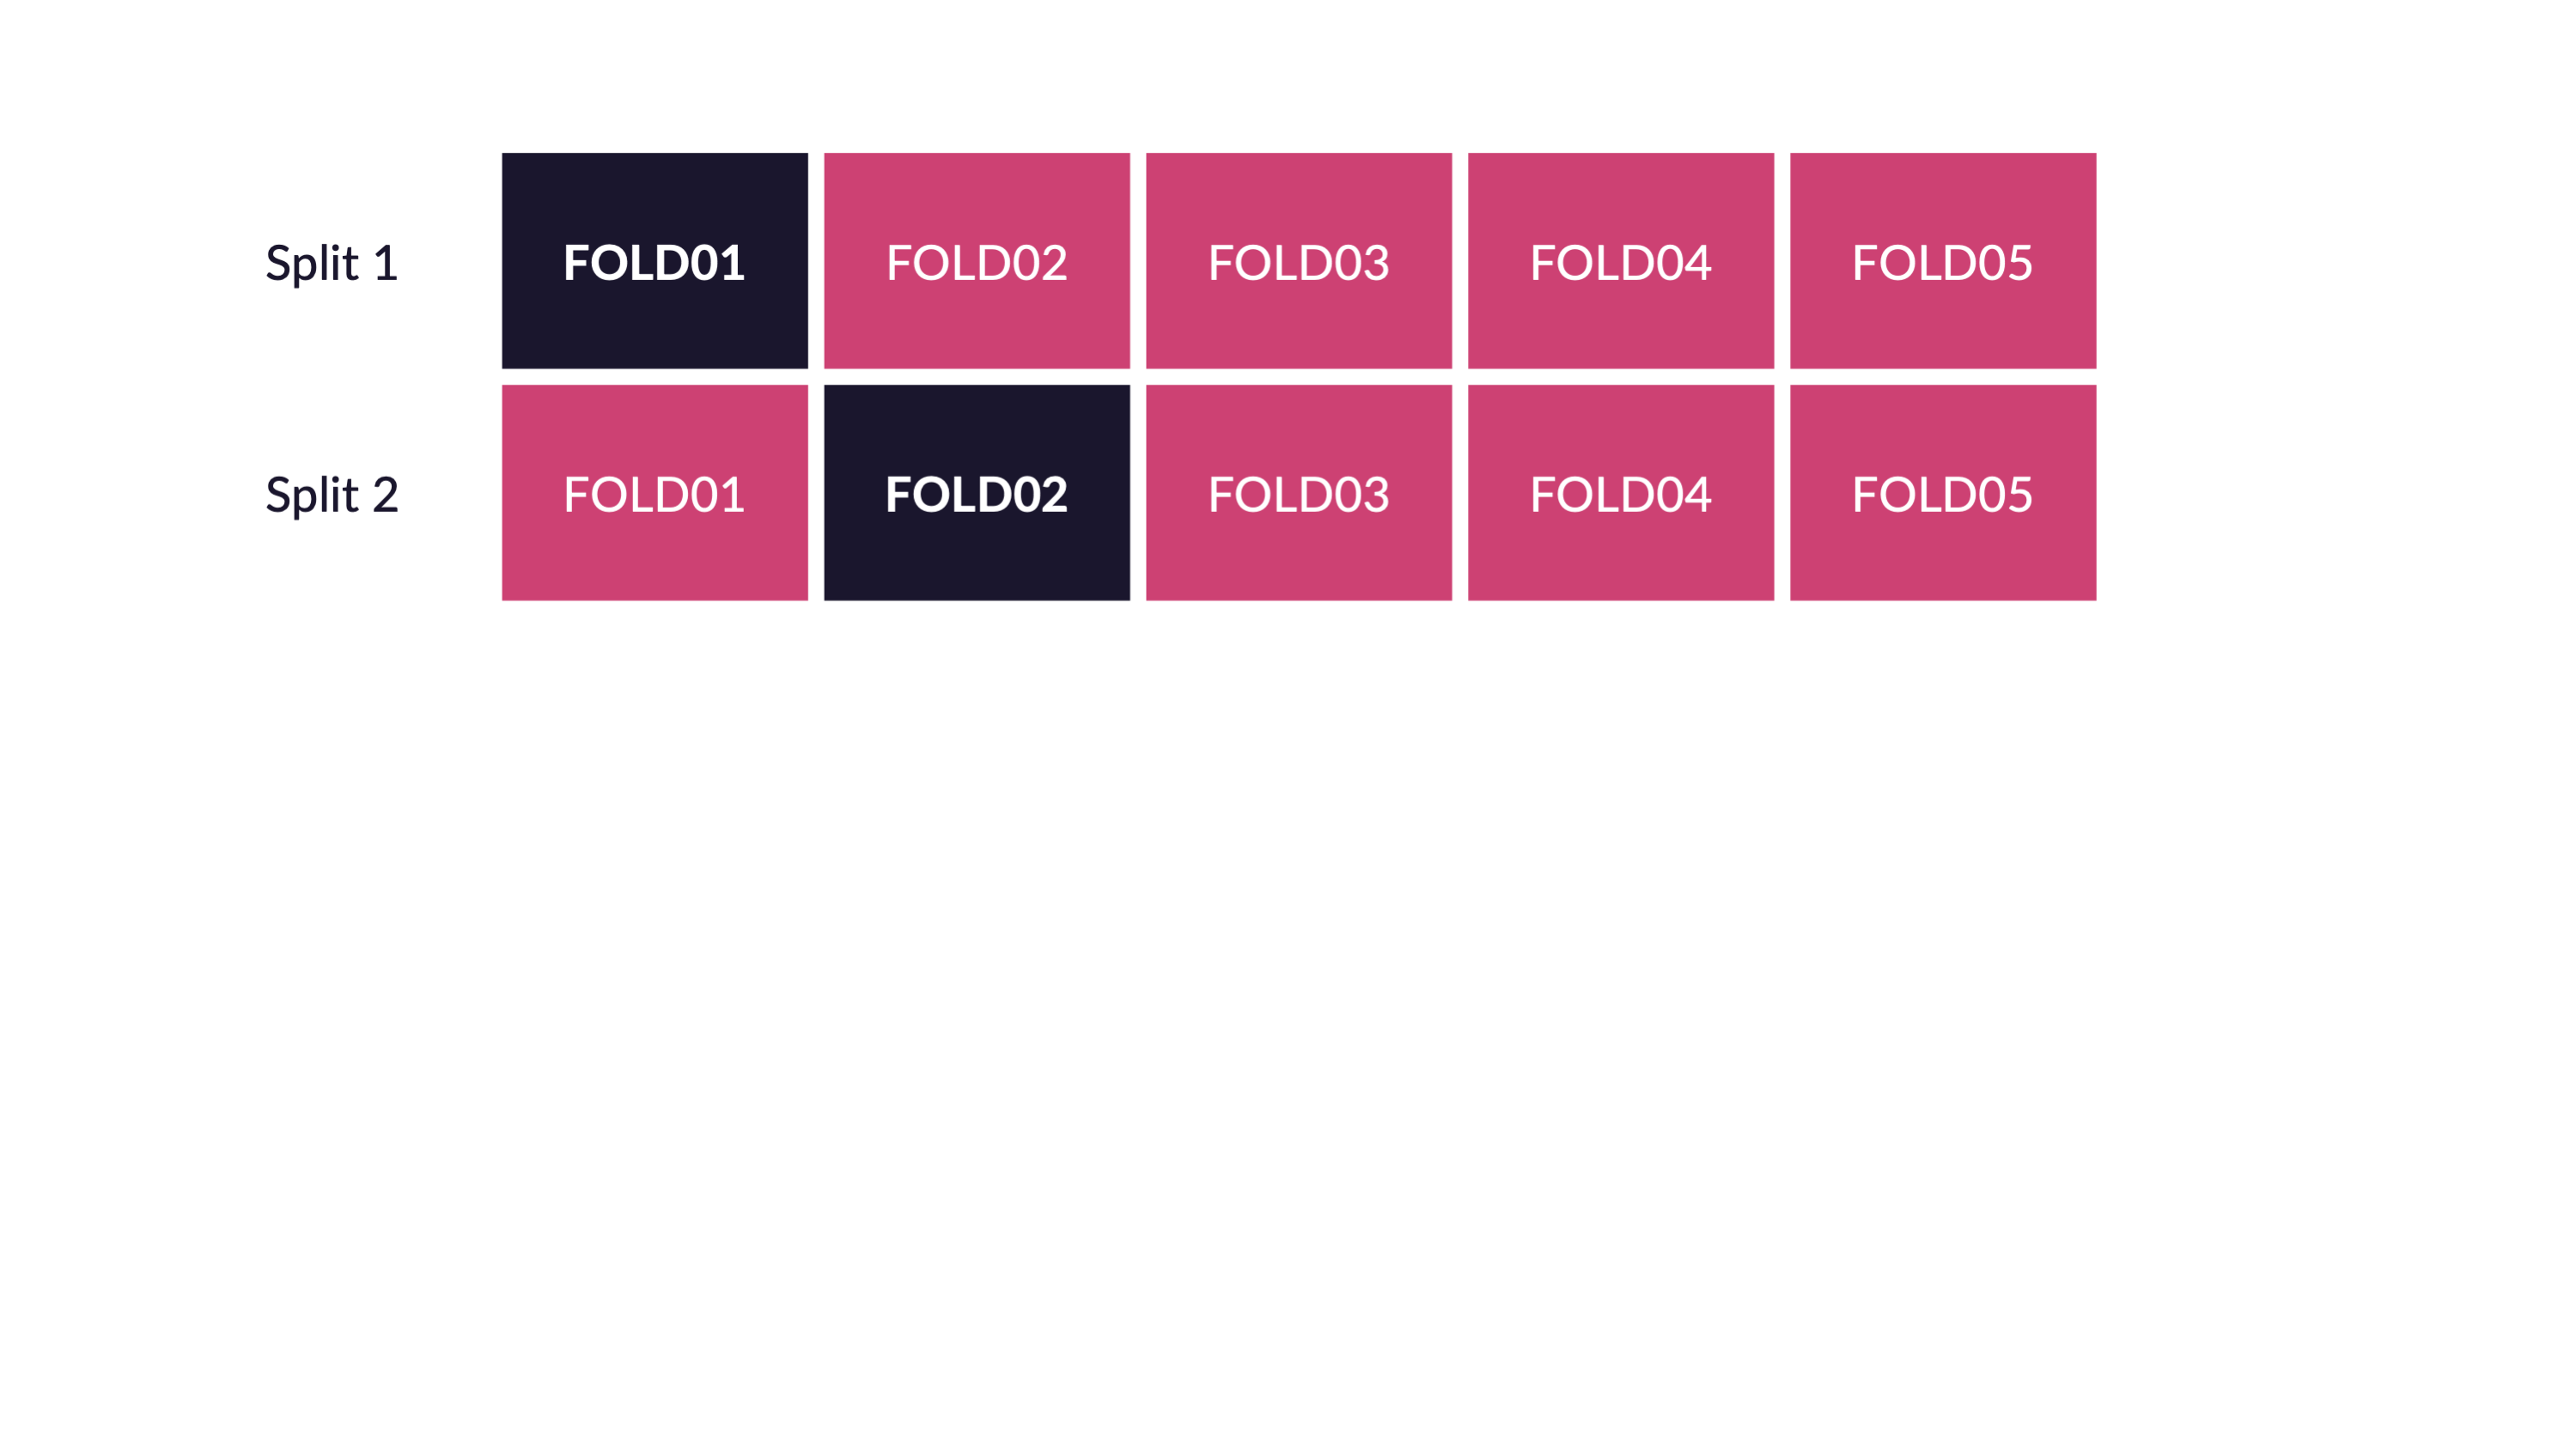
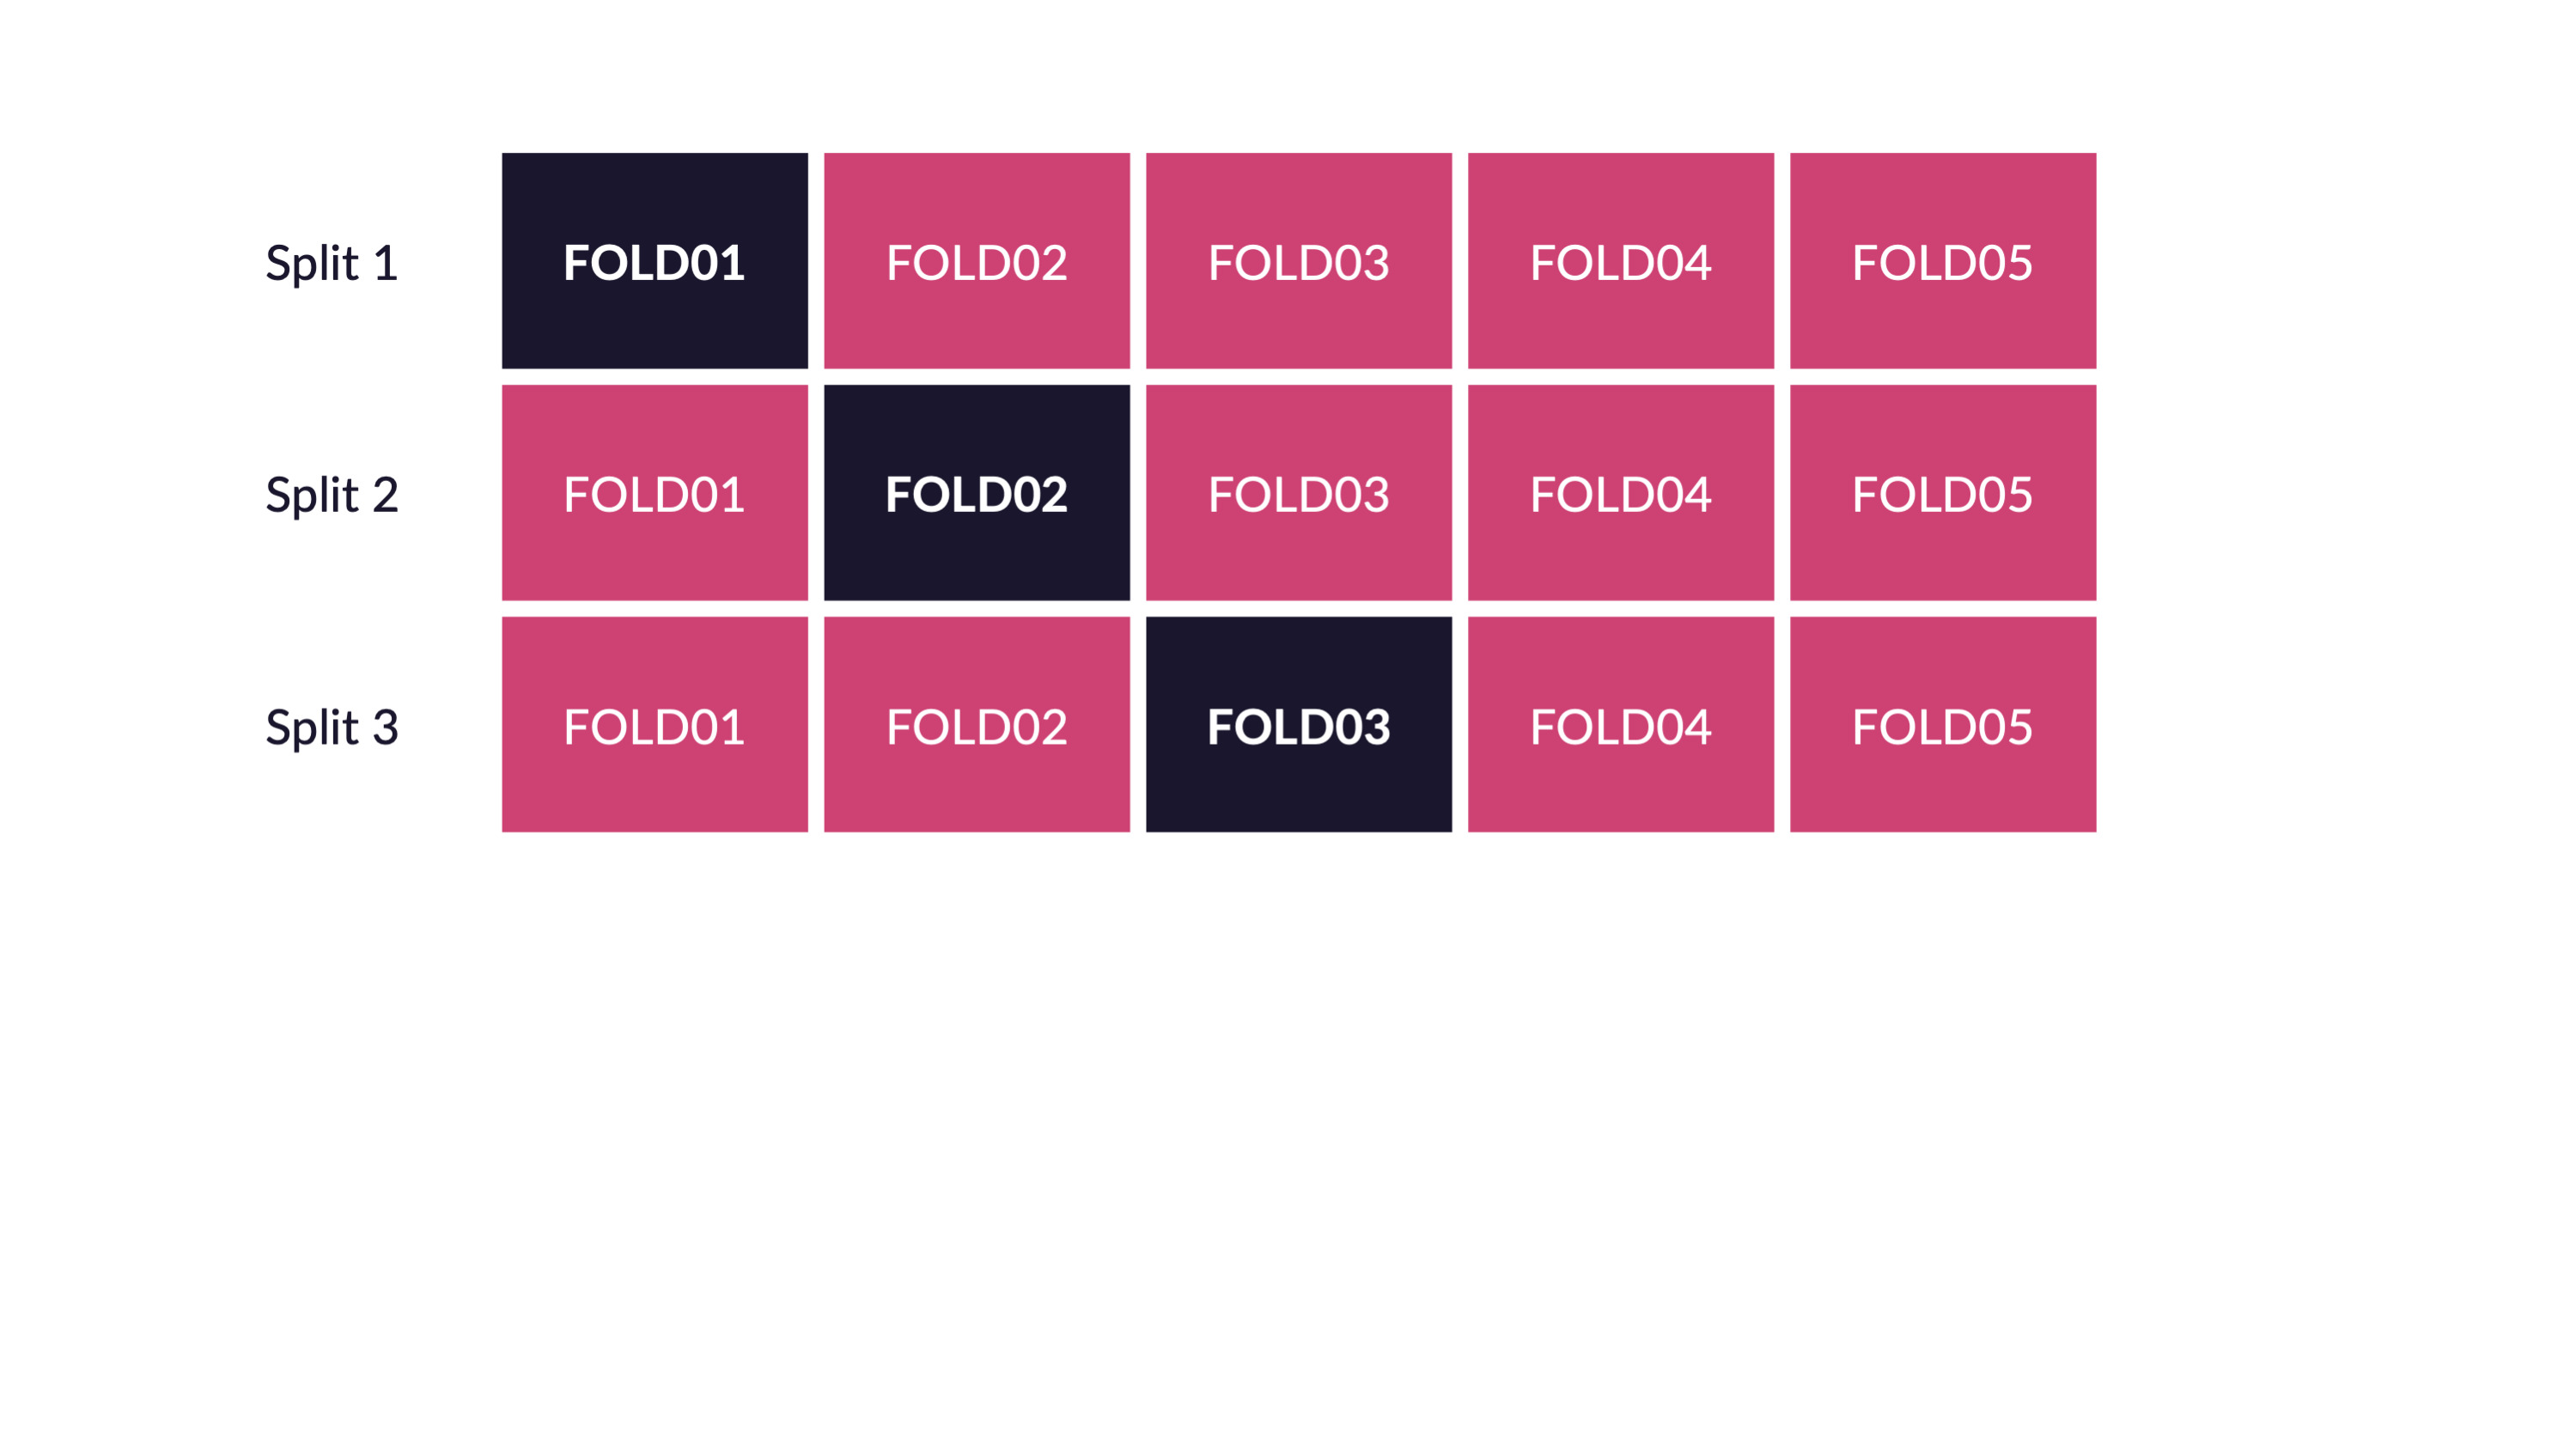
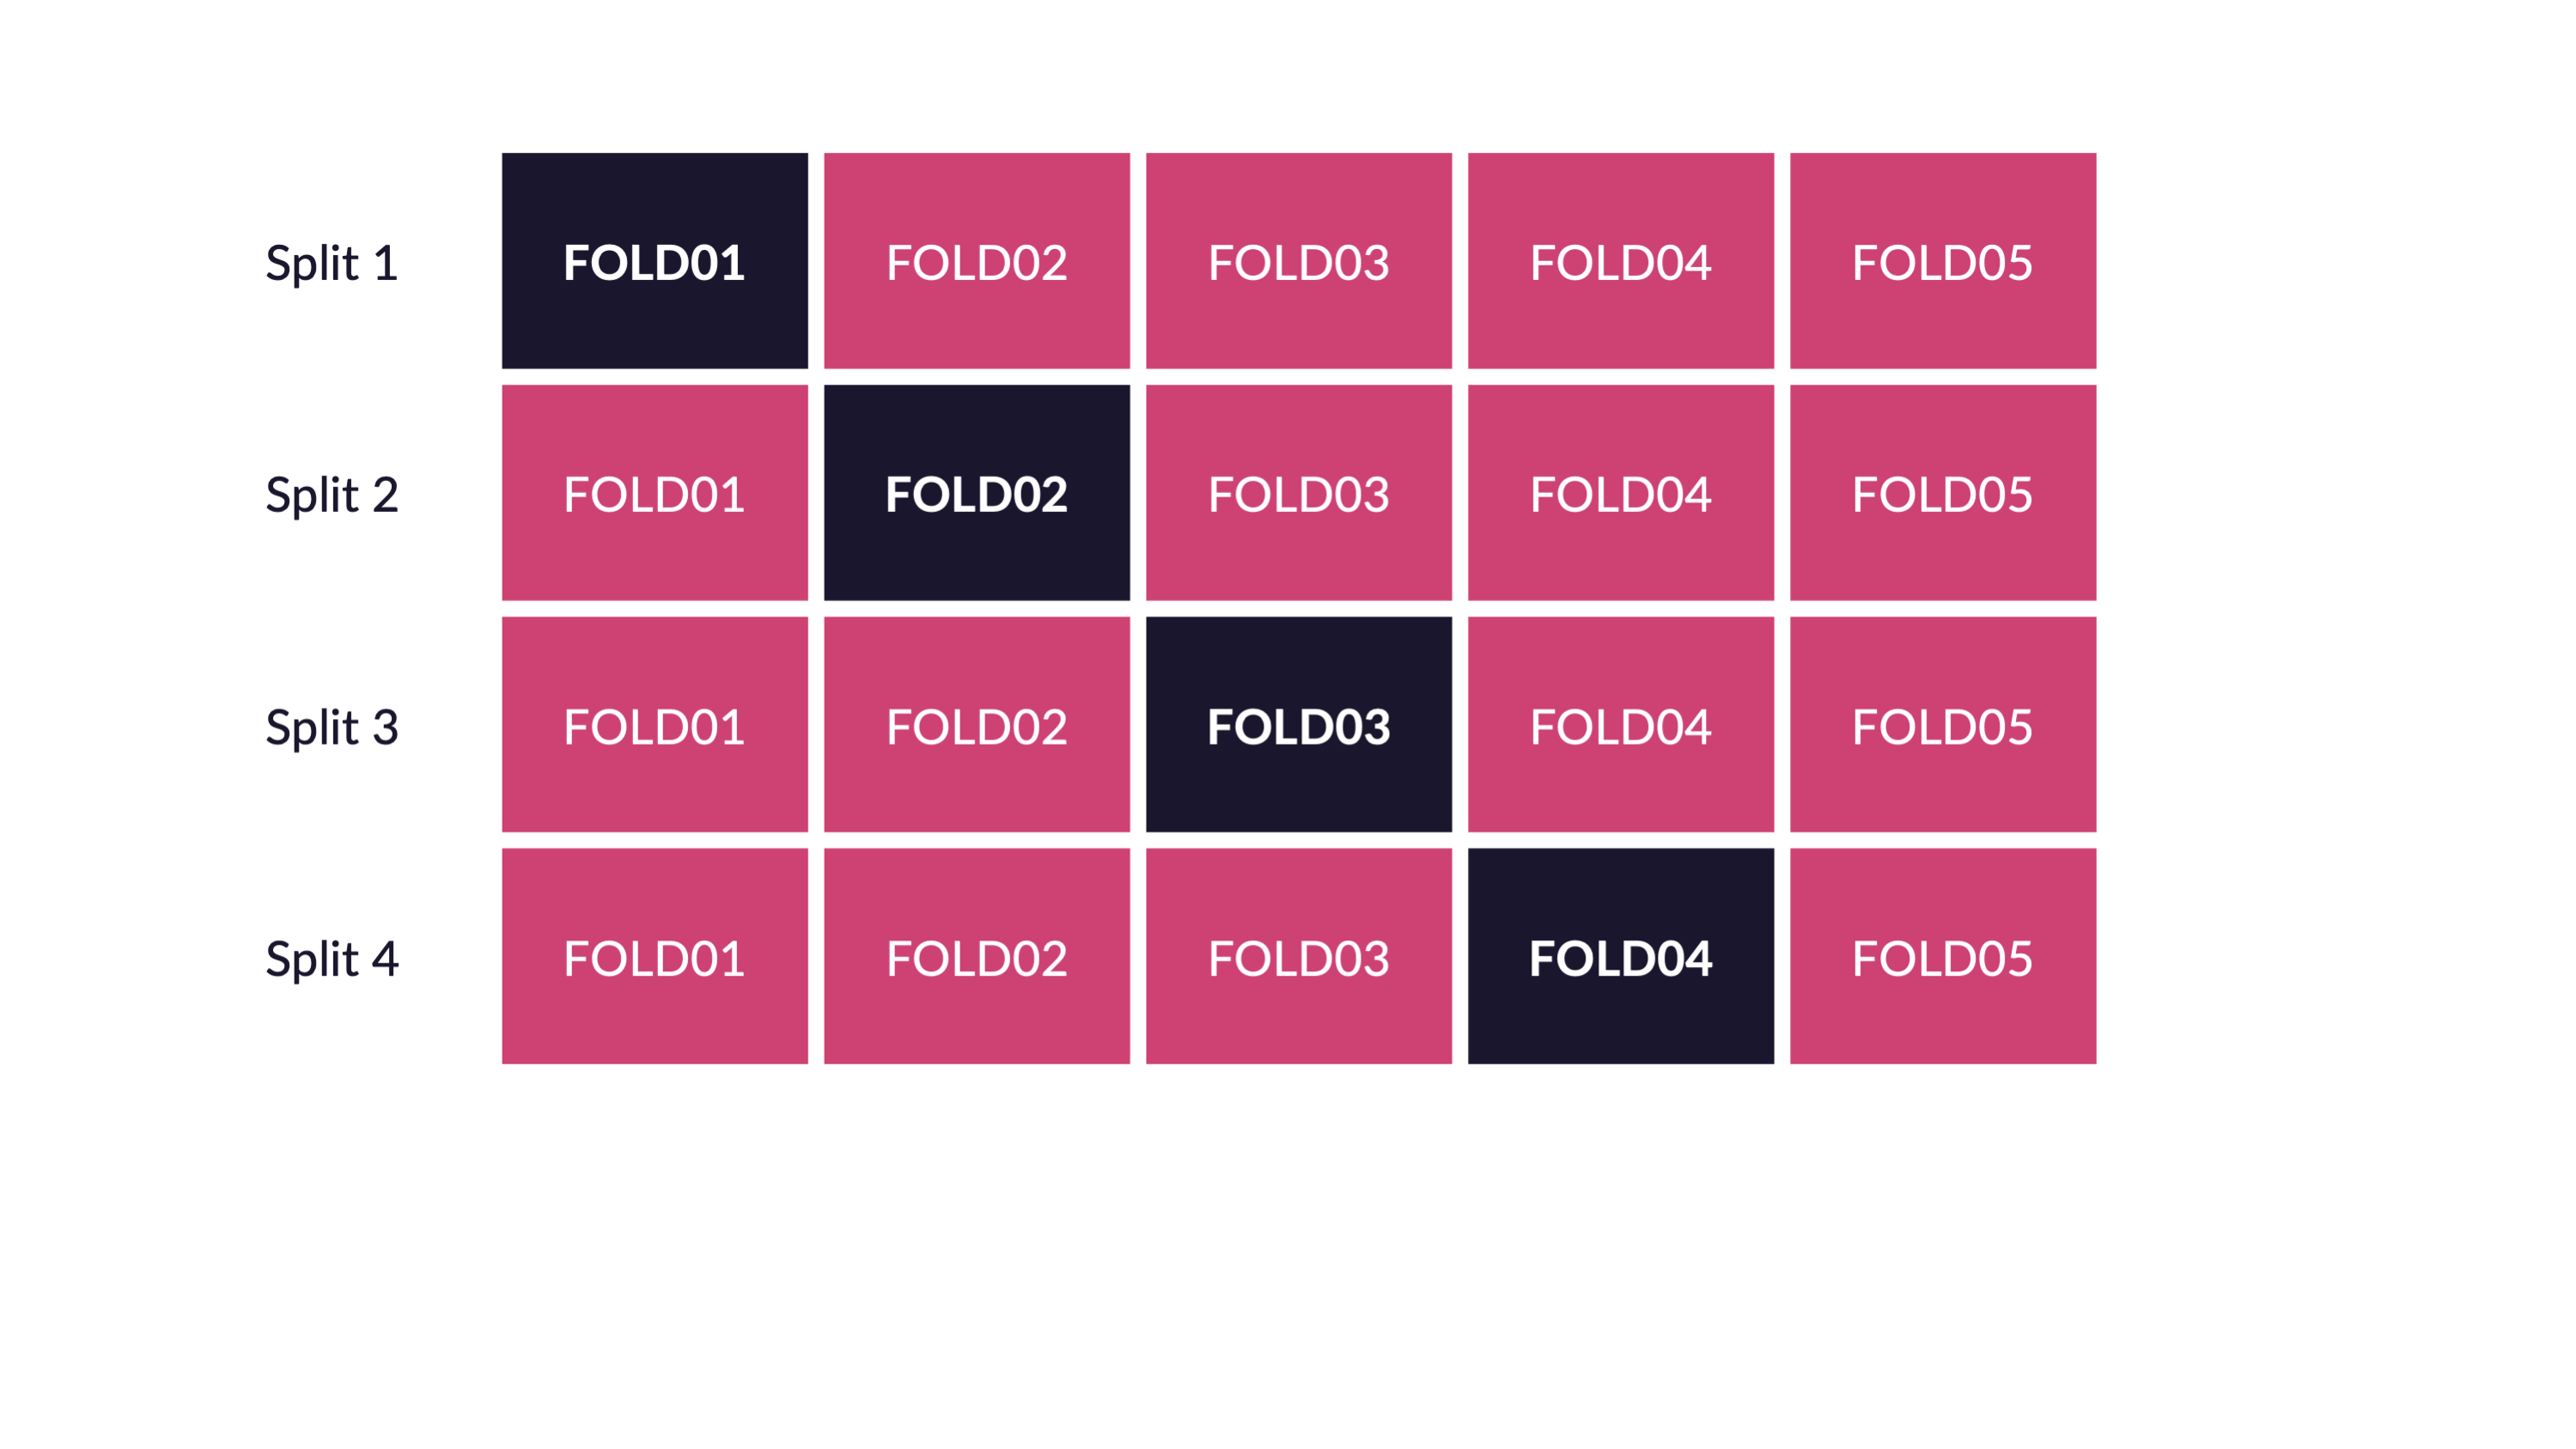
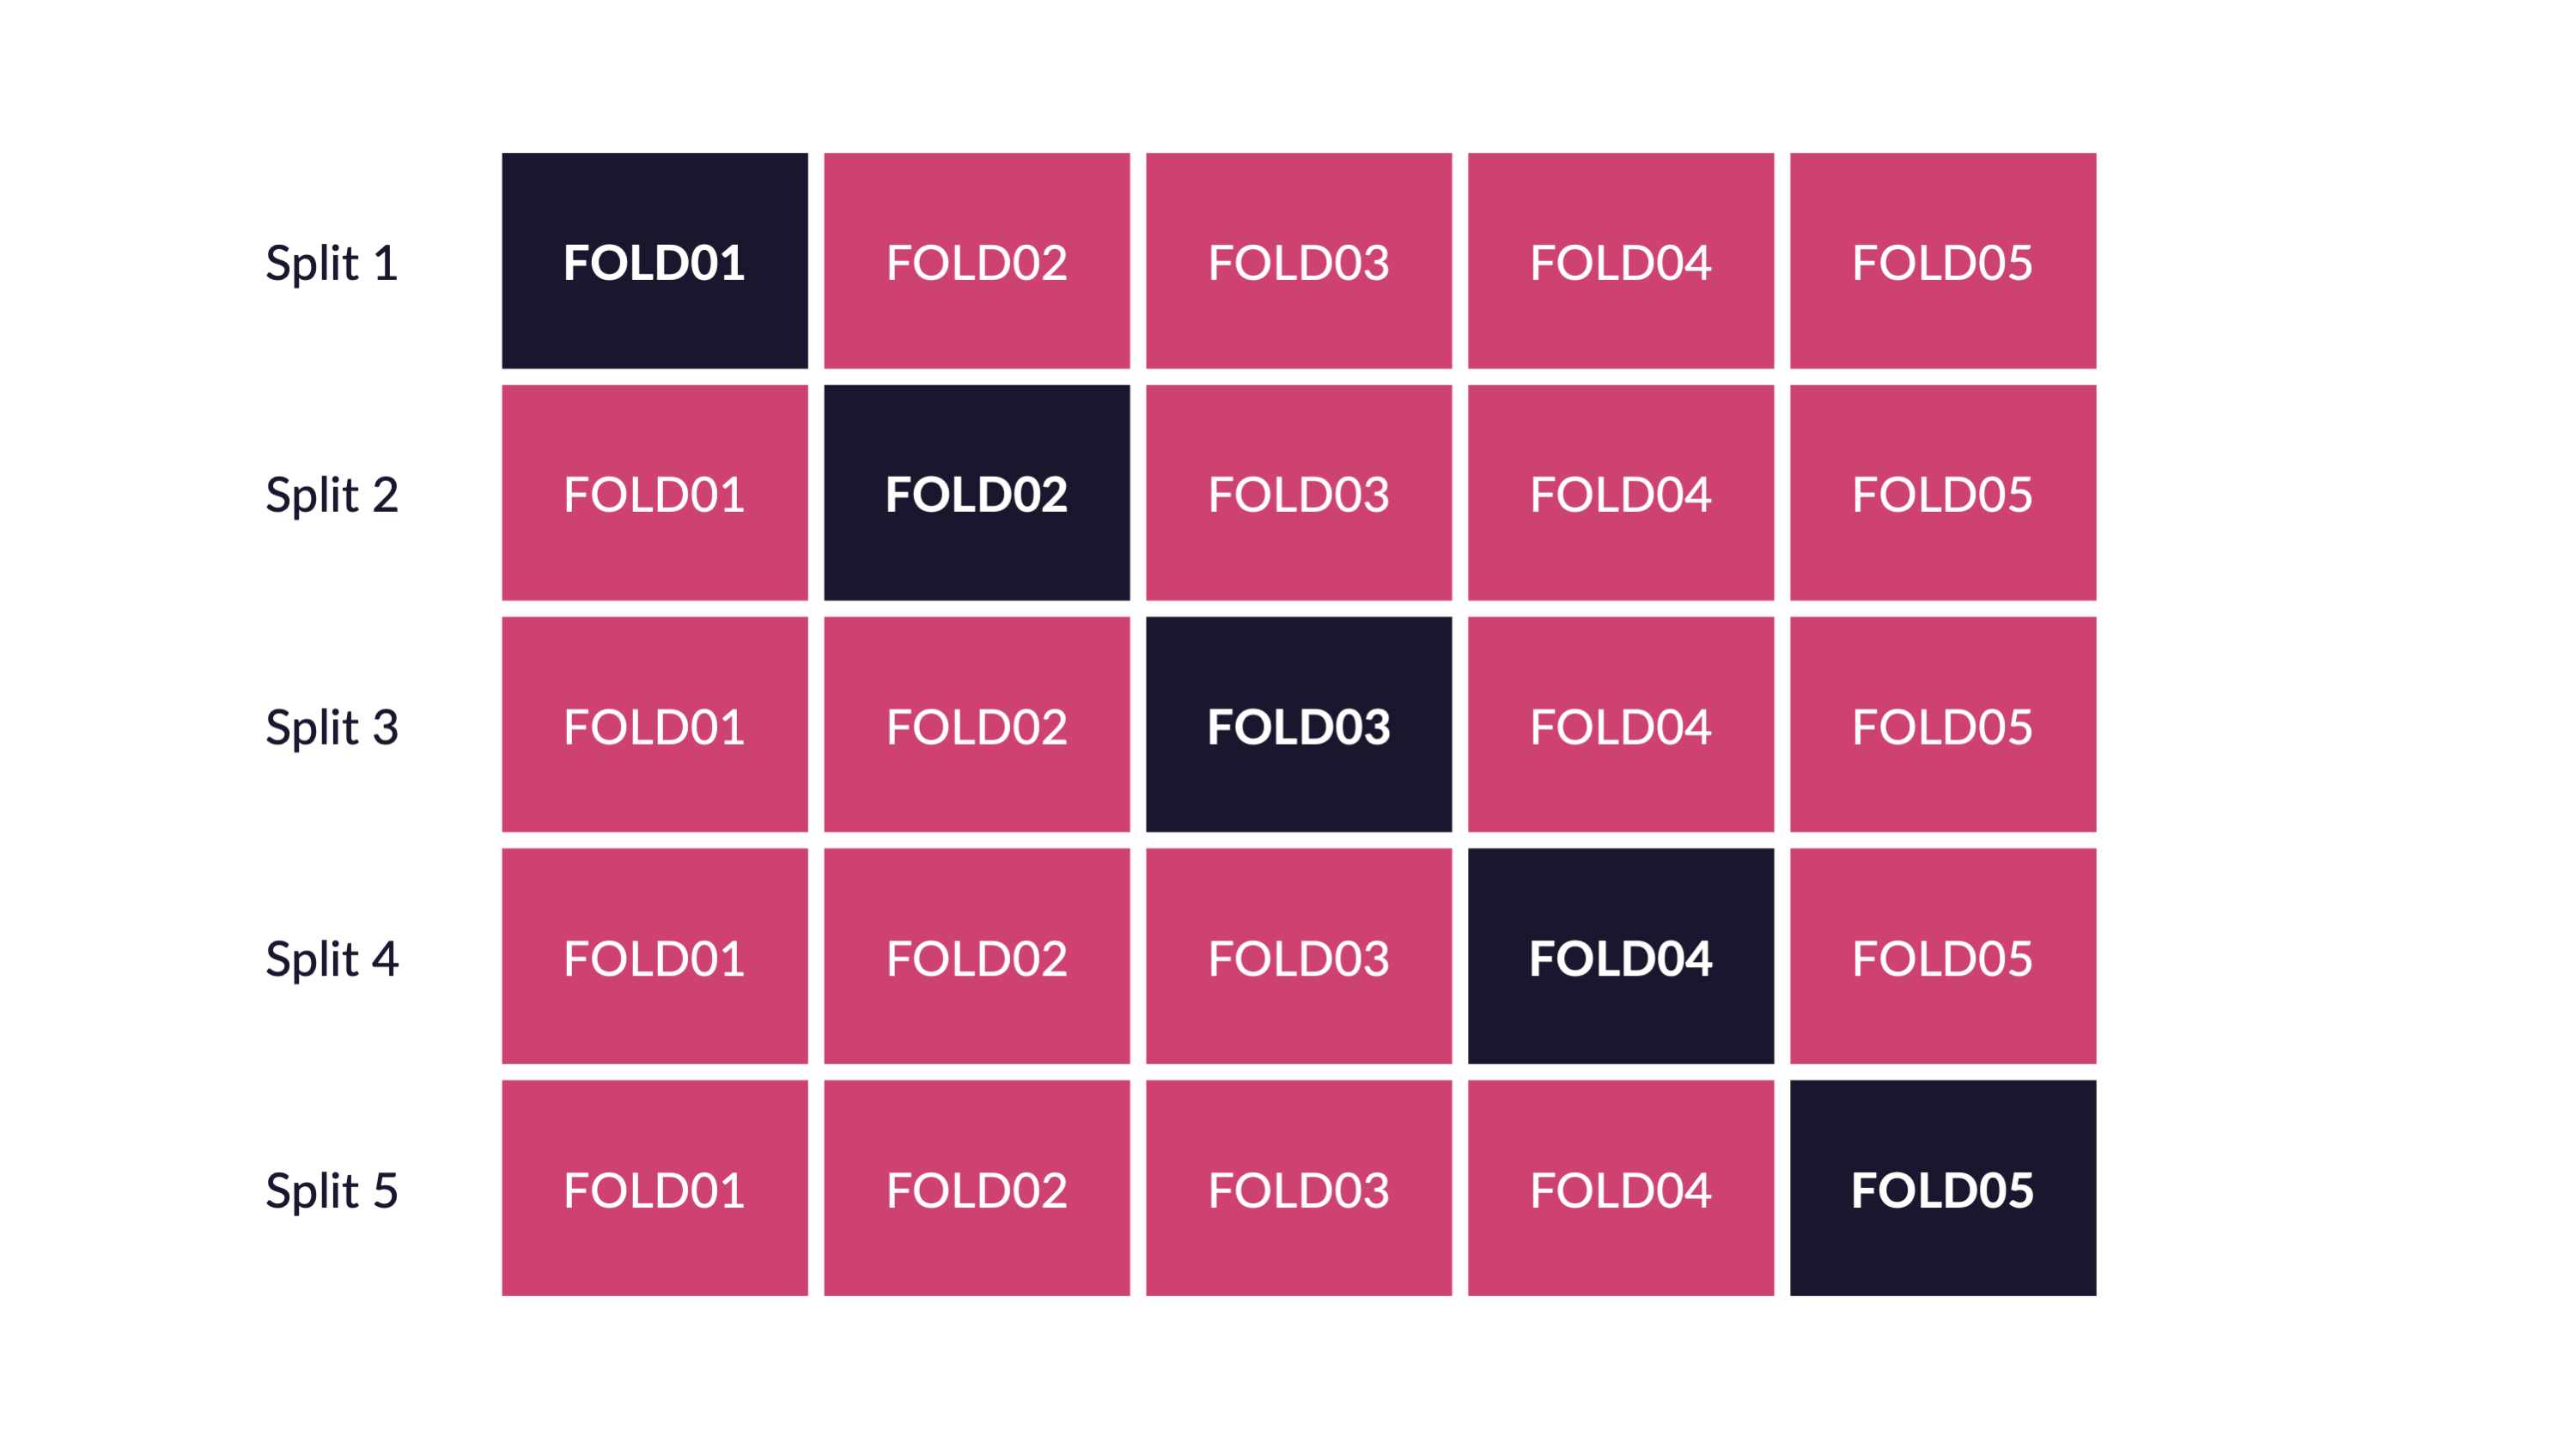
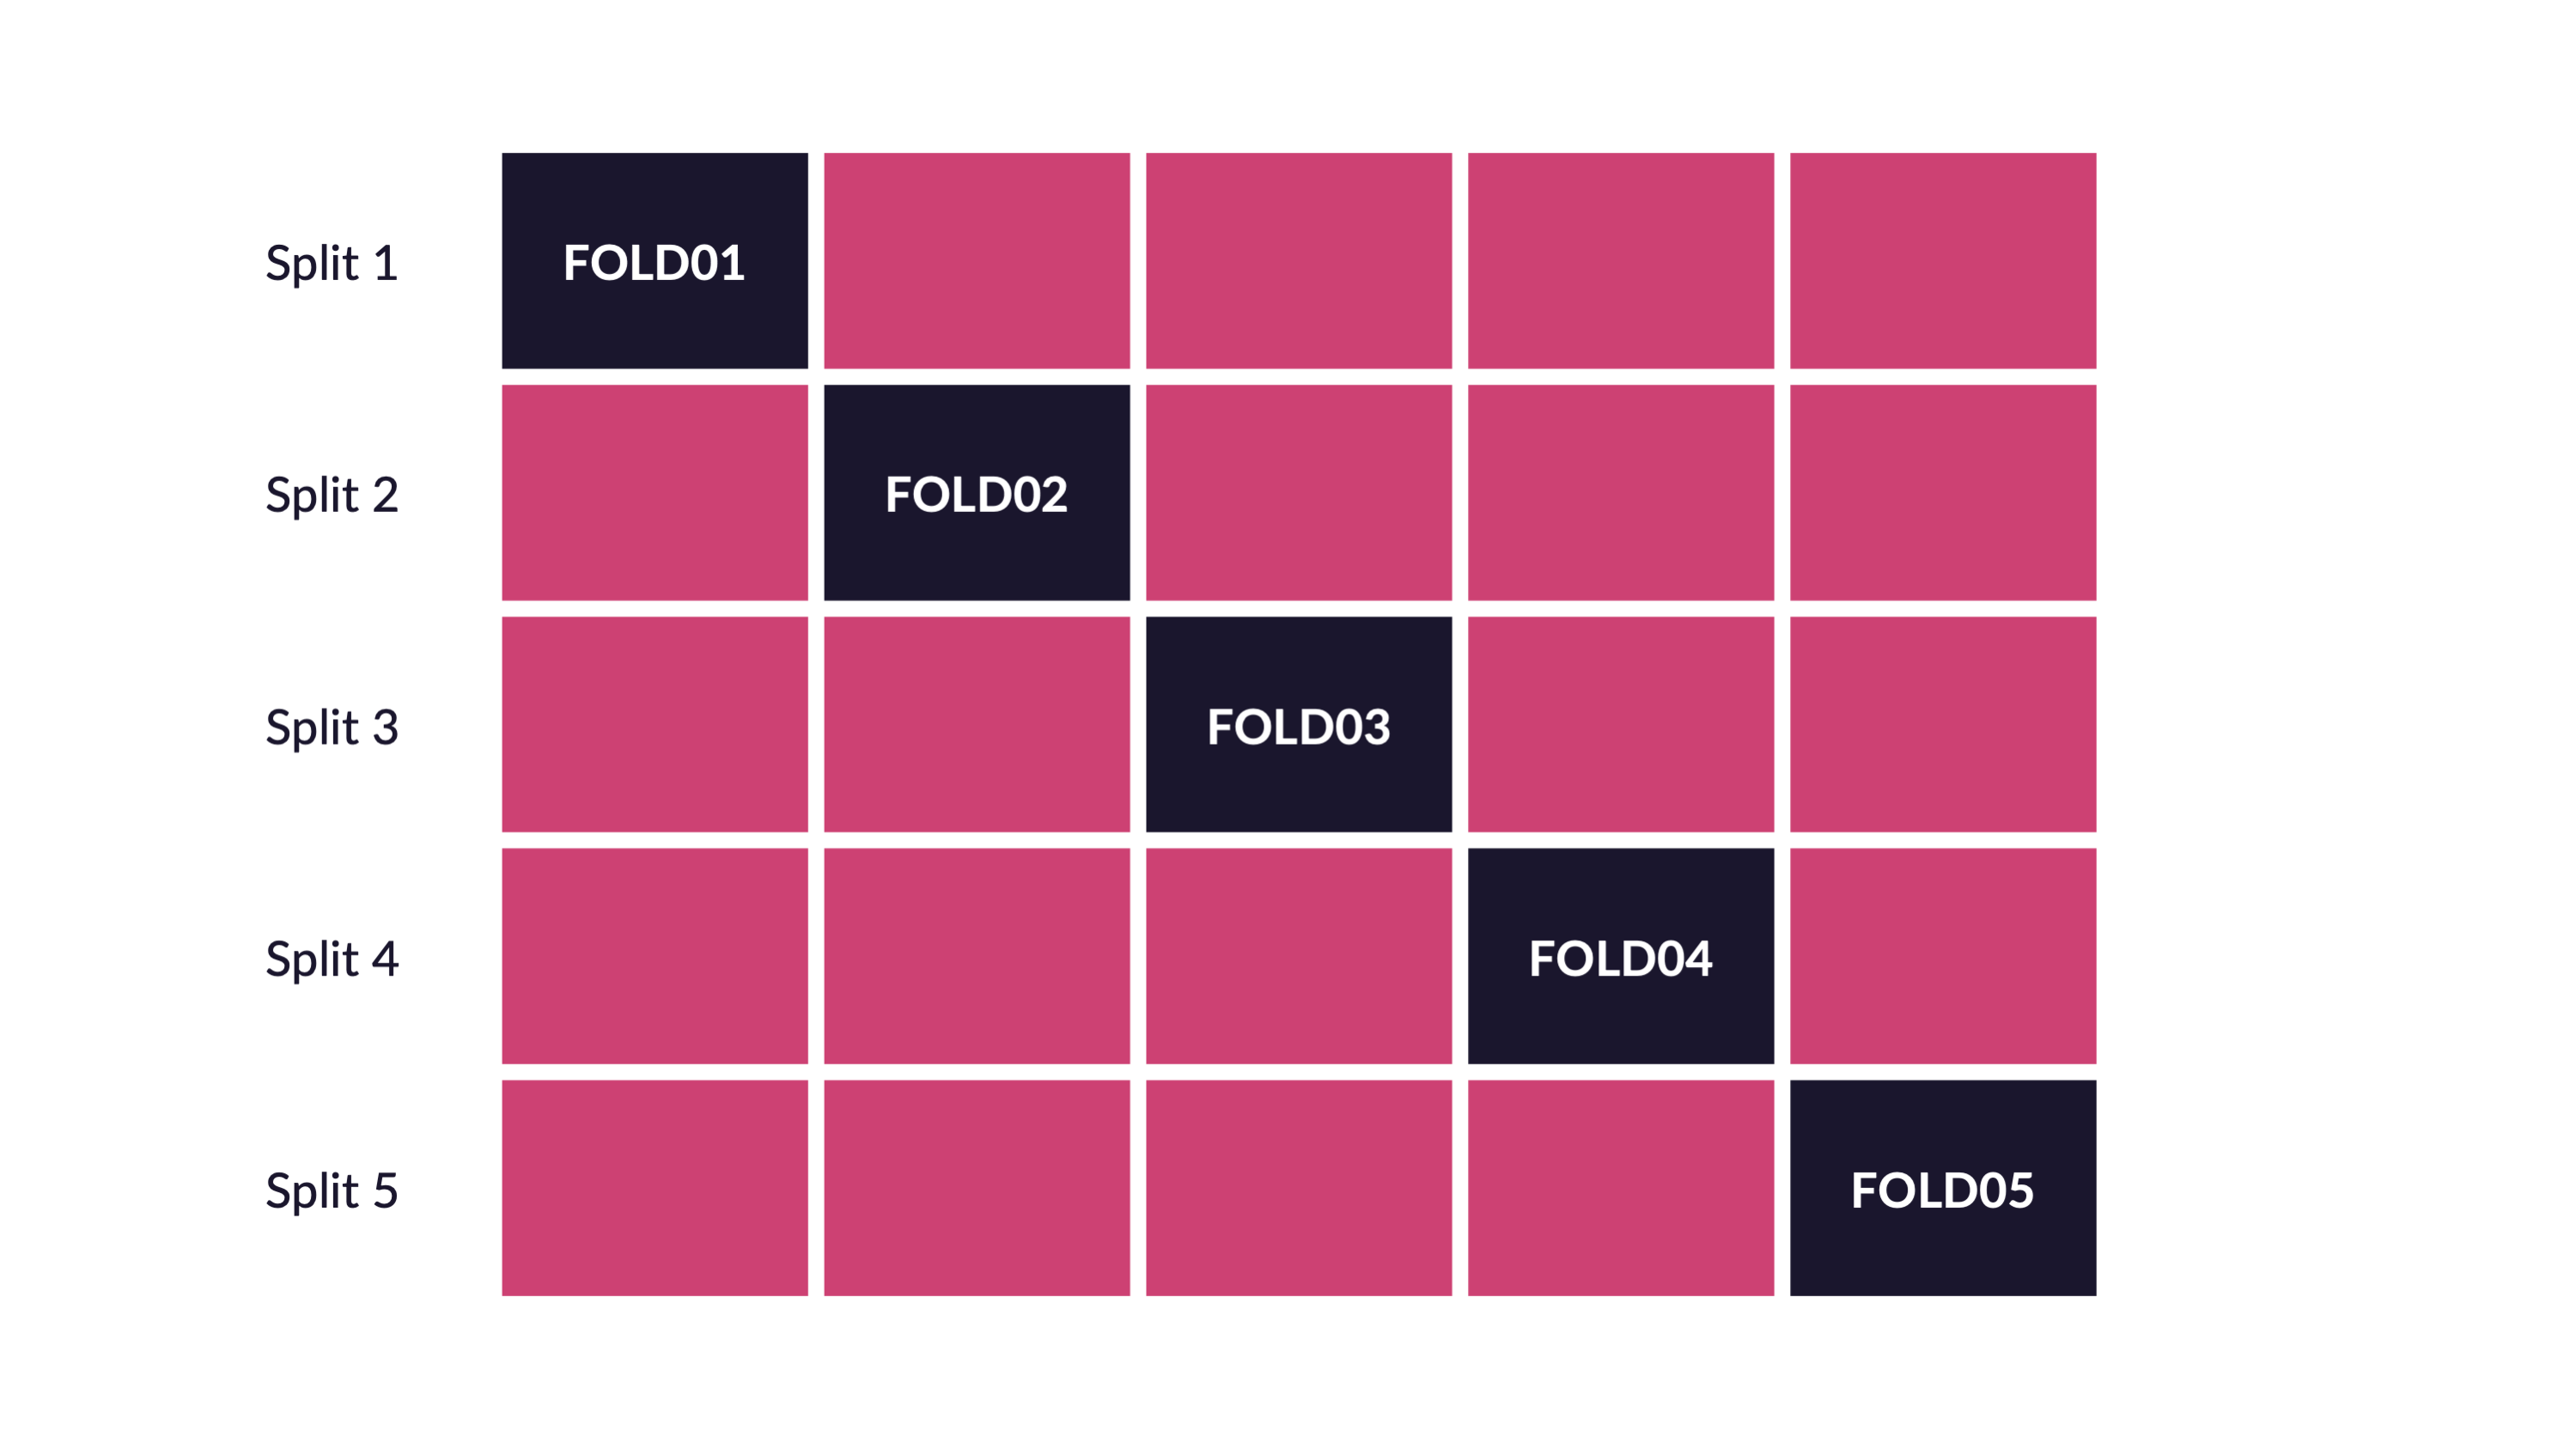
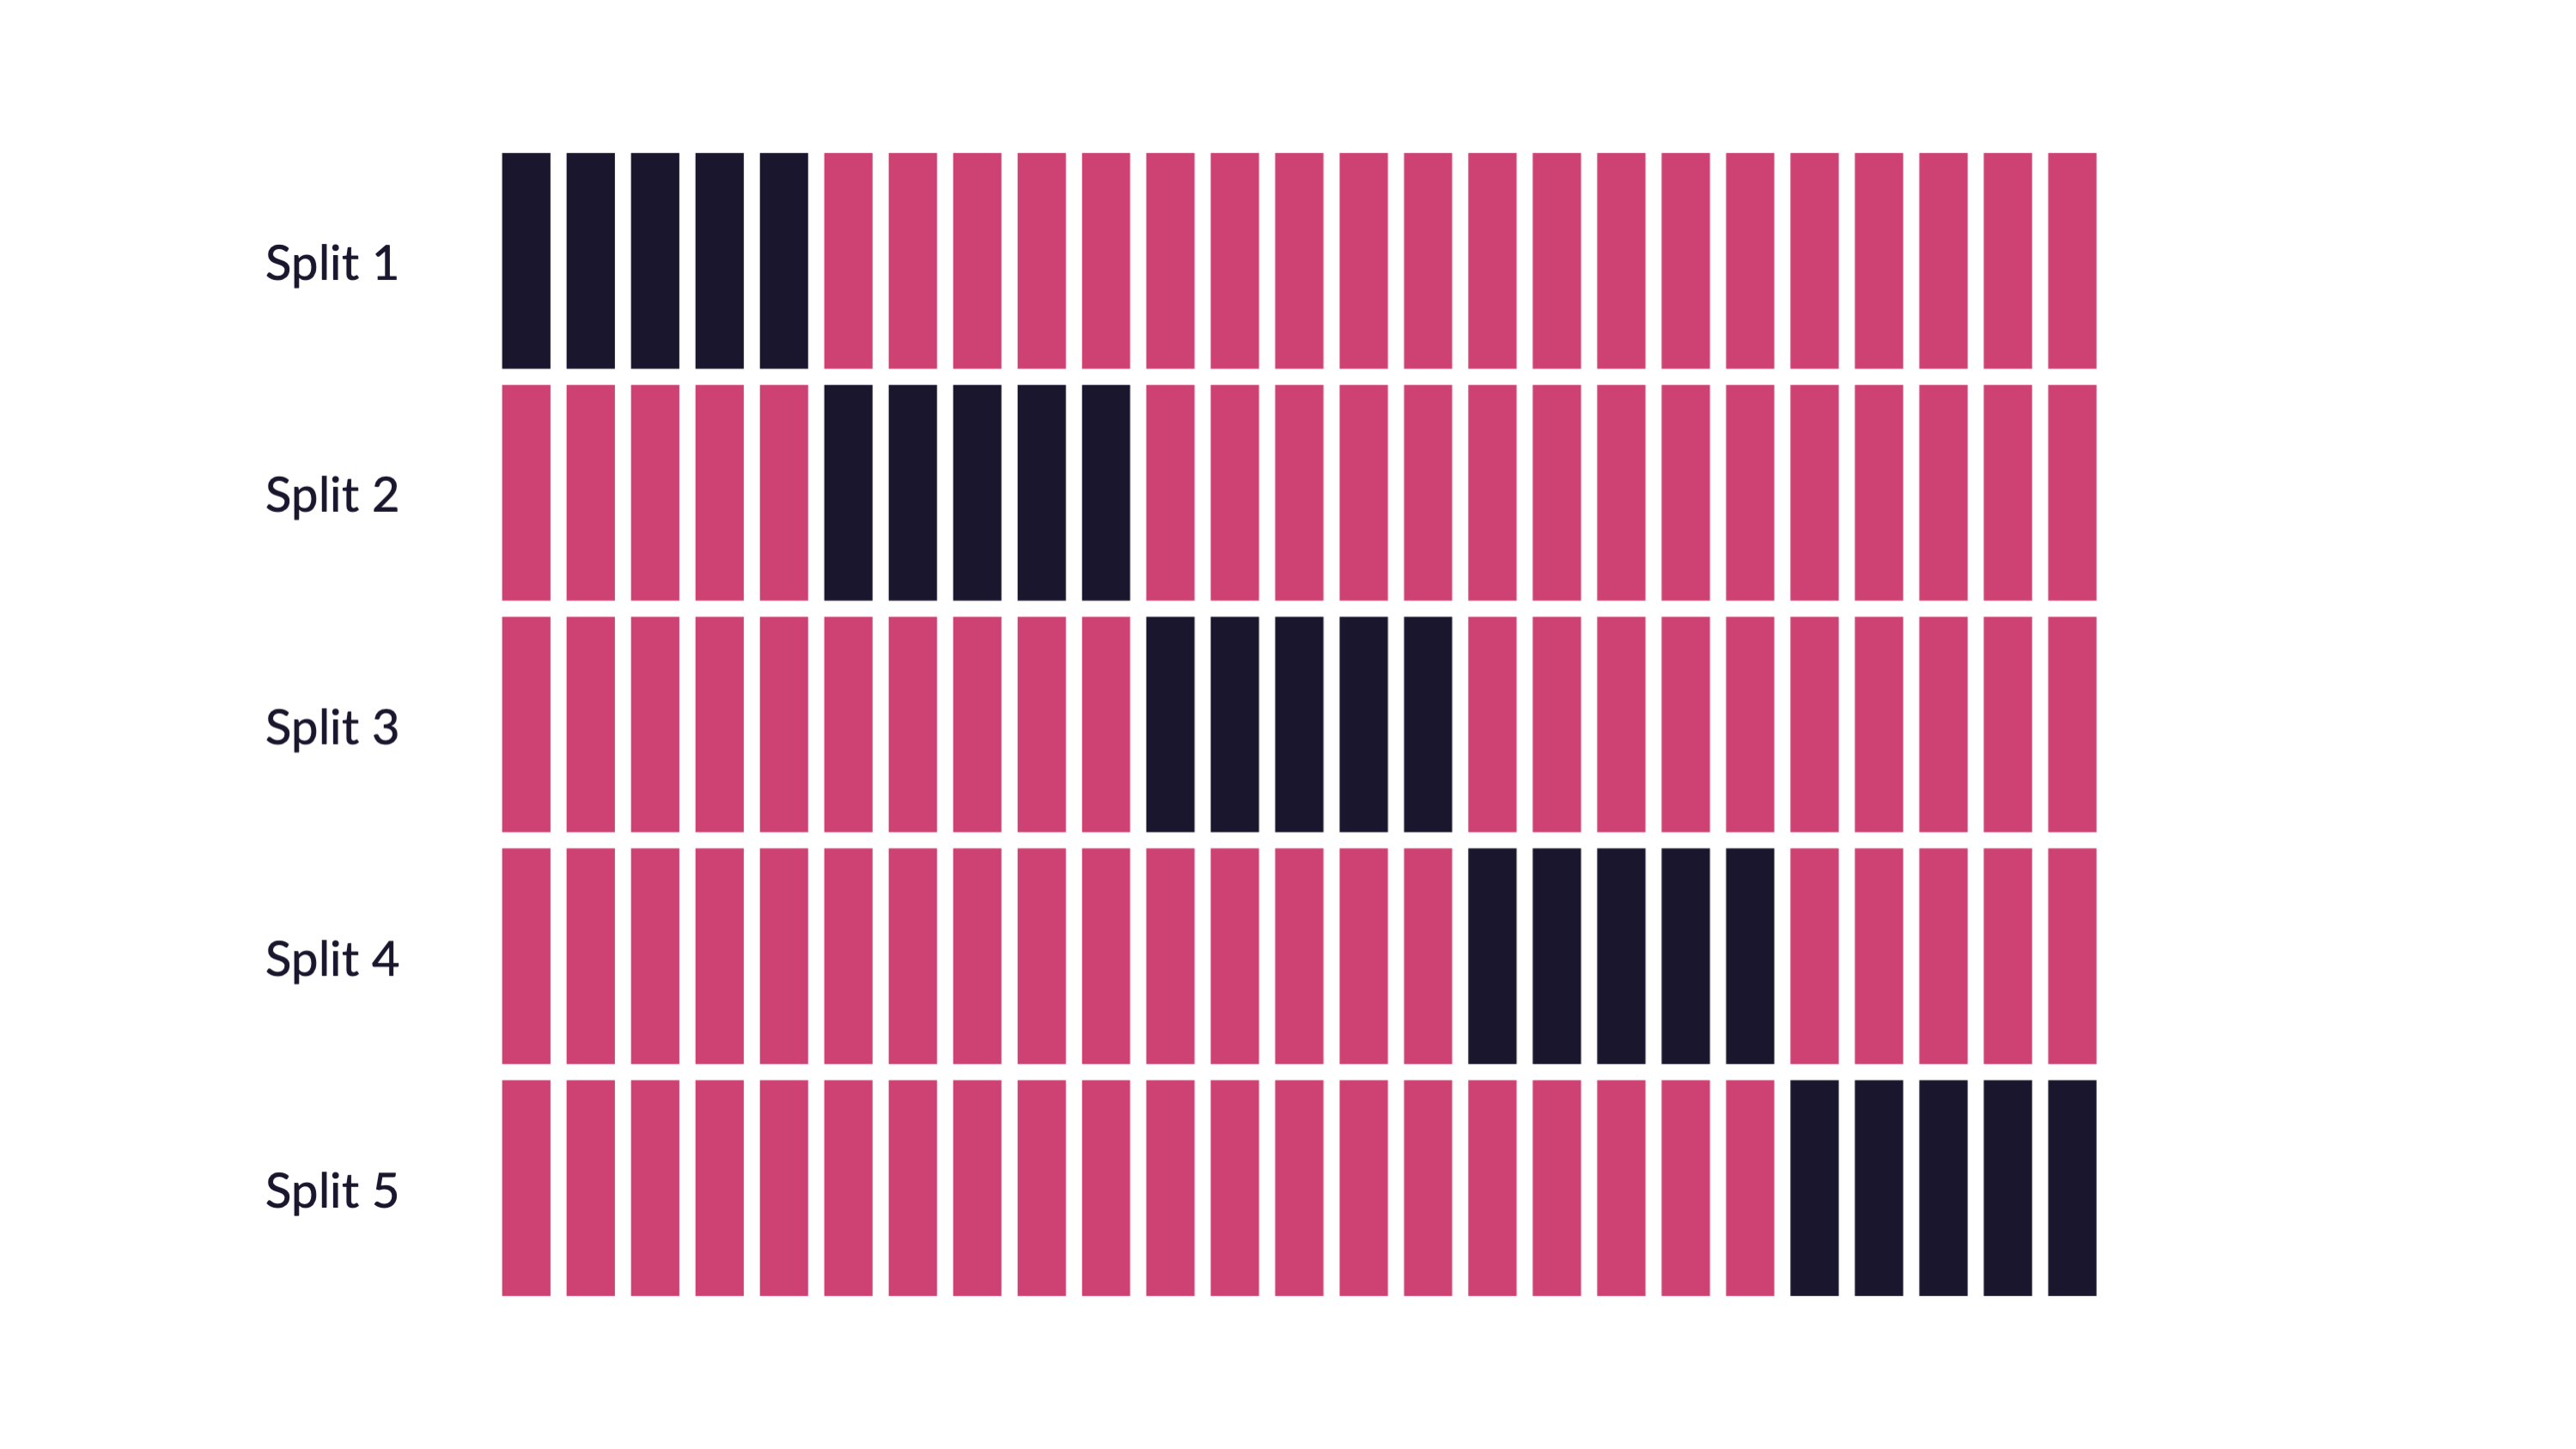
\(V\)-fold cross-validation
- Fit \(V\) models, each on \(V-1\) folds
- Evaluate each model on the held-out fold
- Average the assessment metrics across the \(V\) models
Each observation is used \(V-1\) times for training, and once for testing
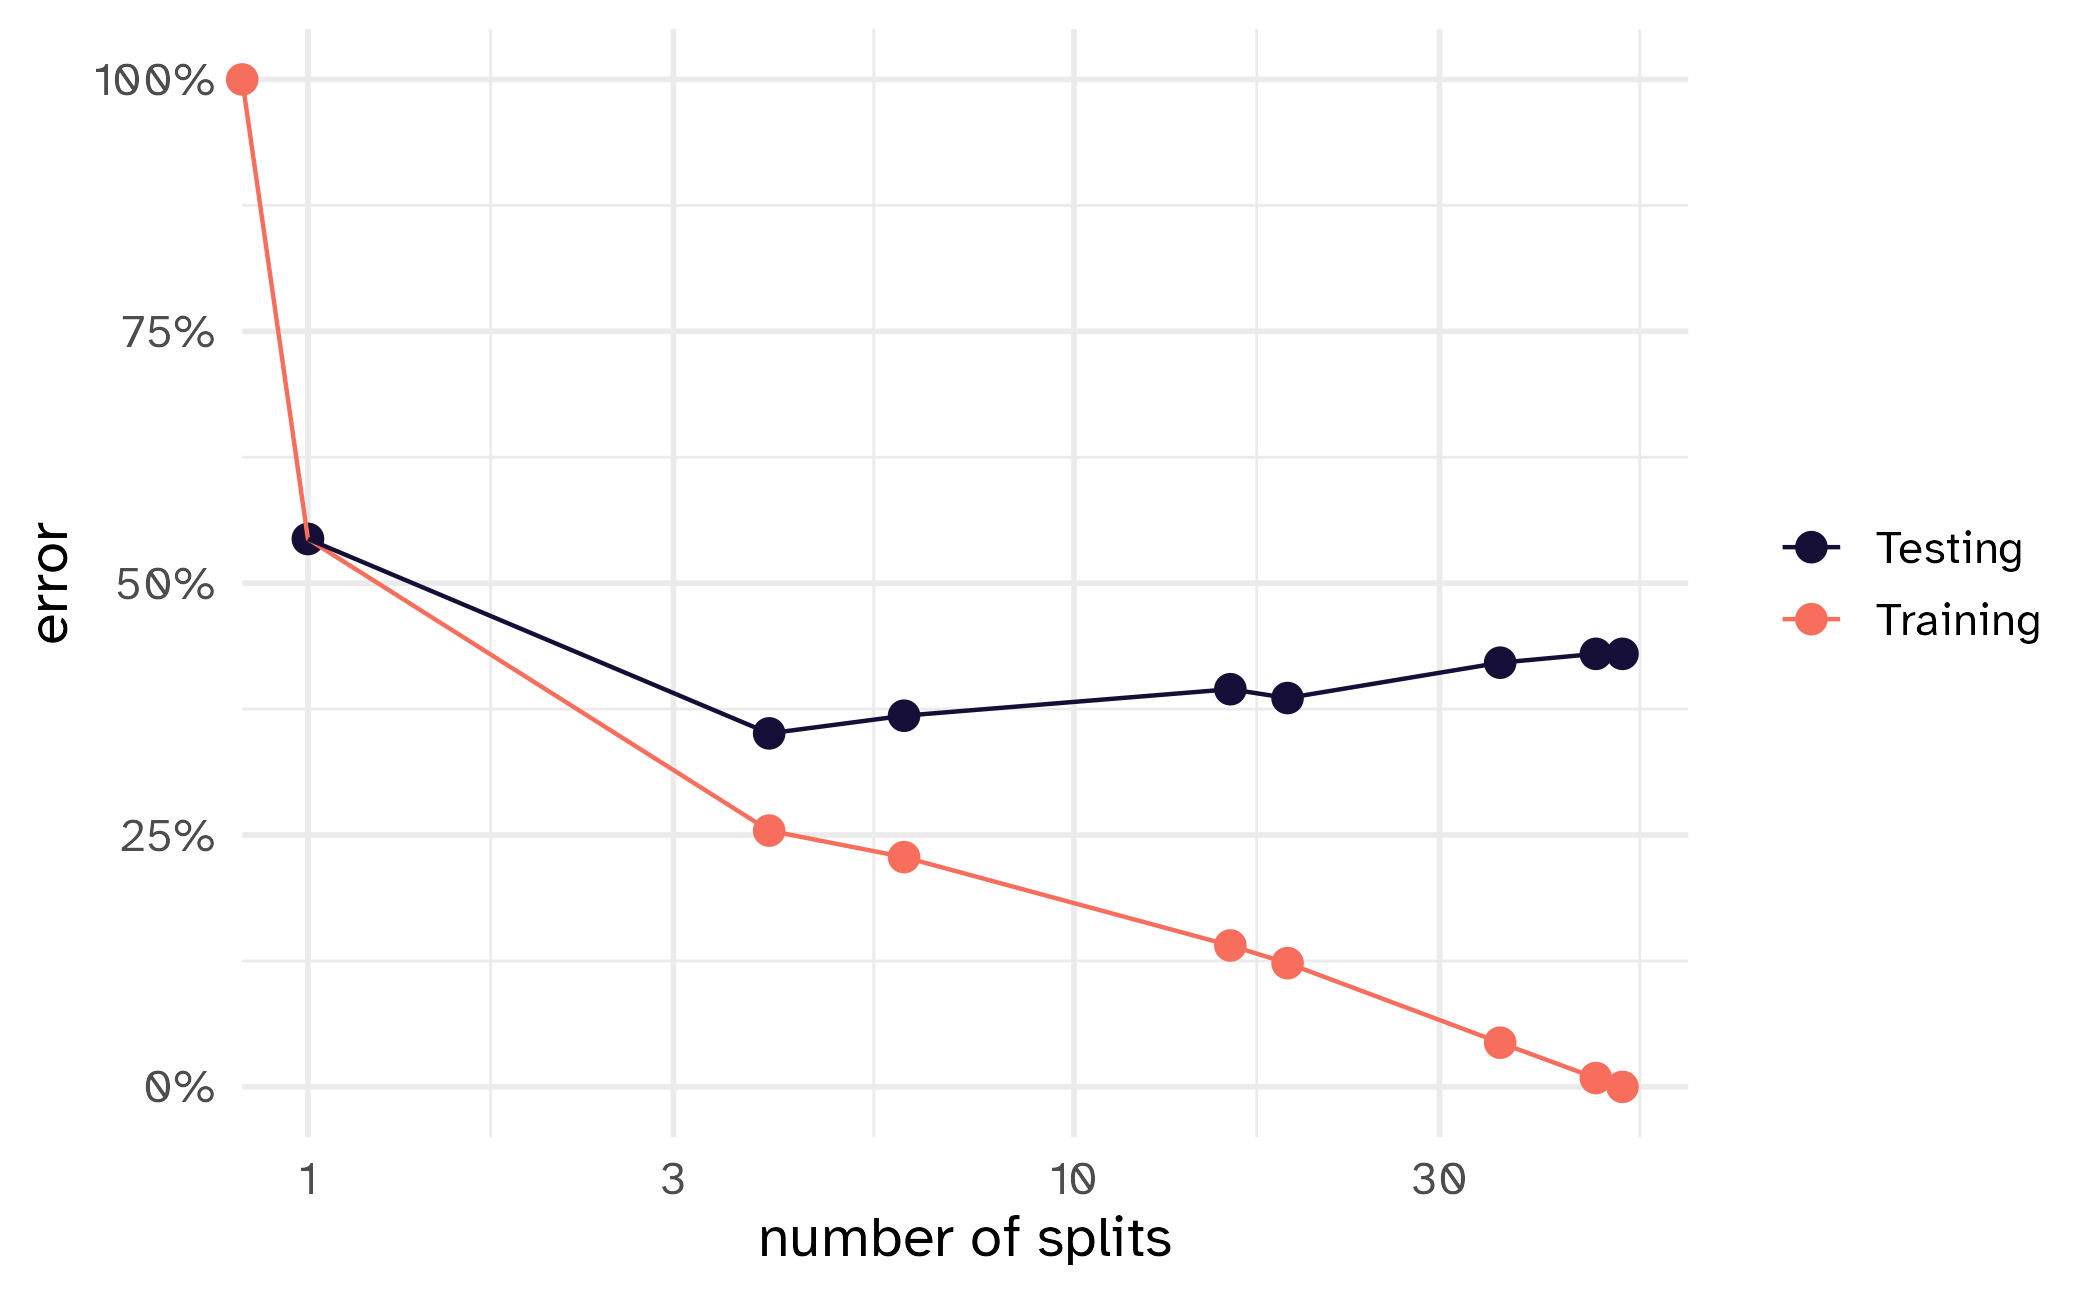
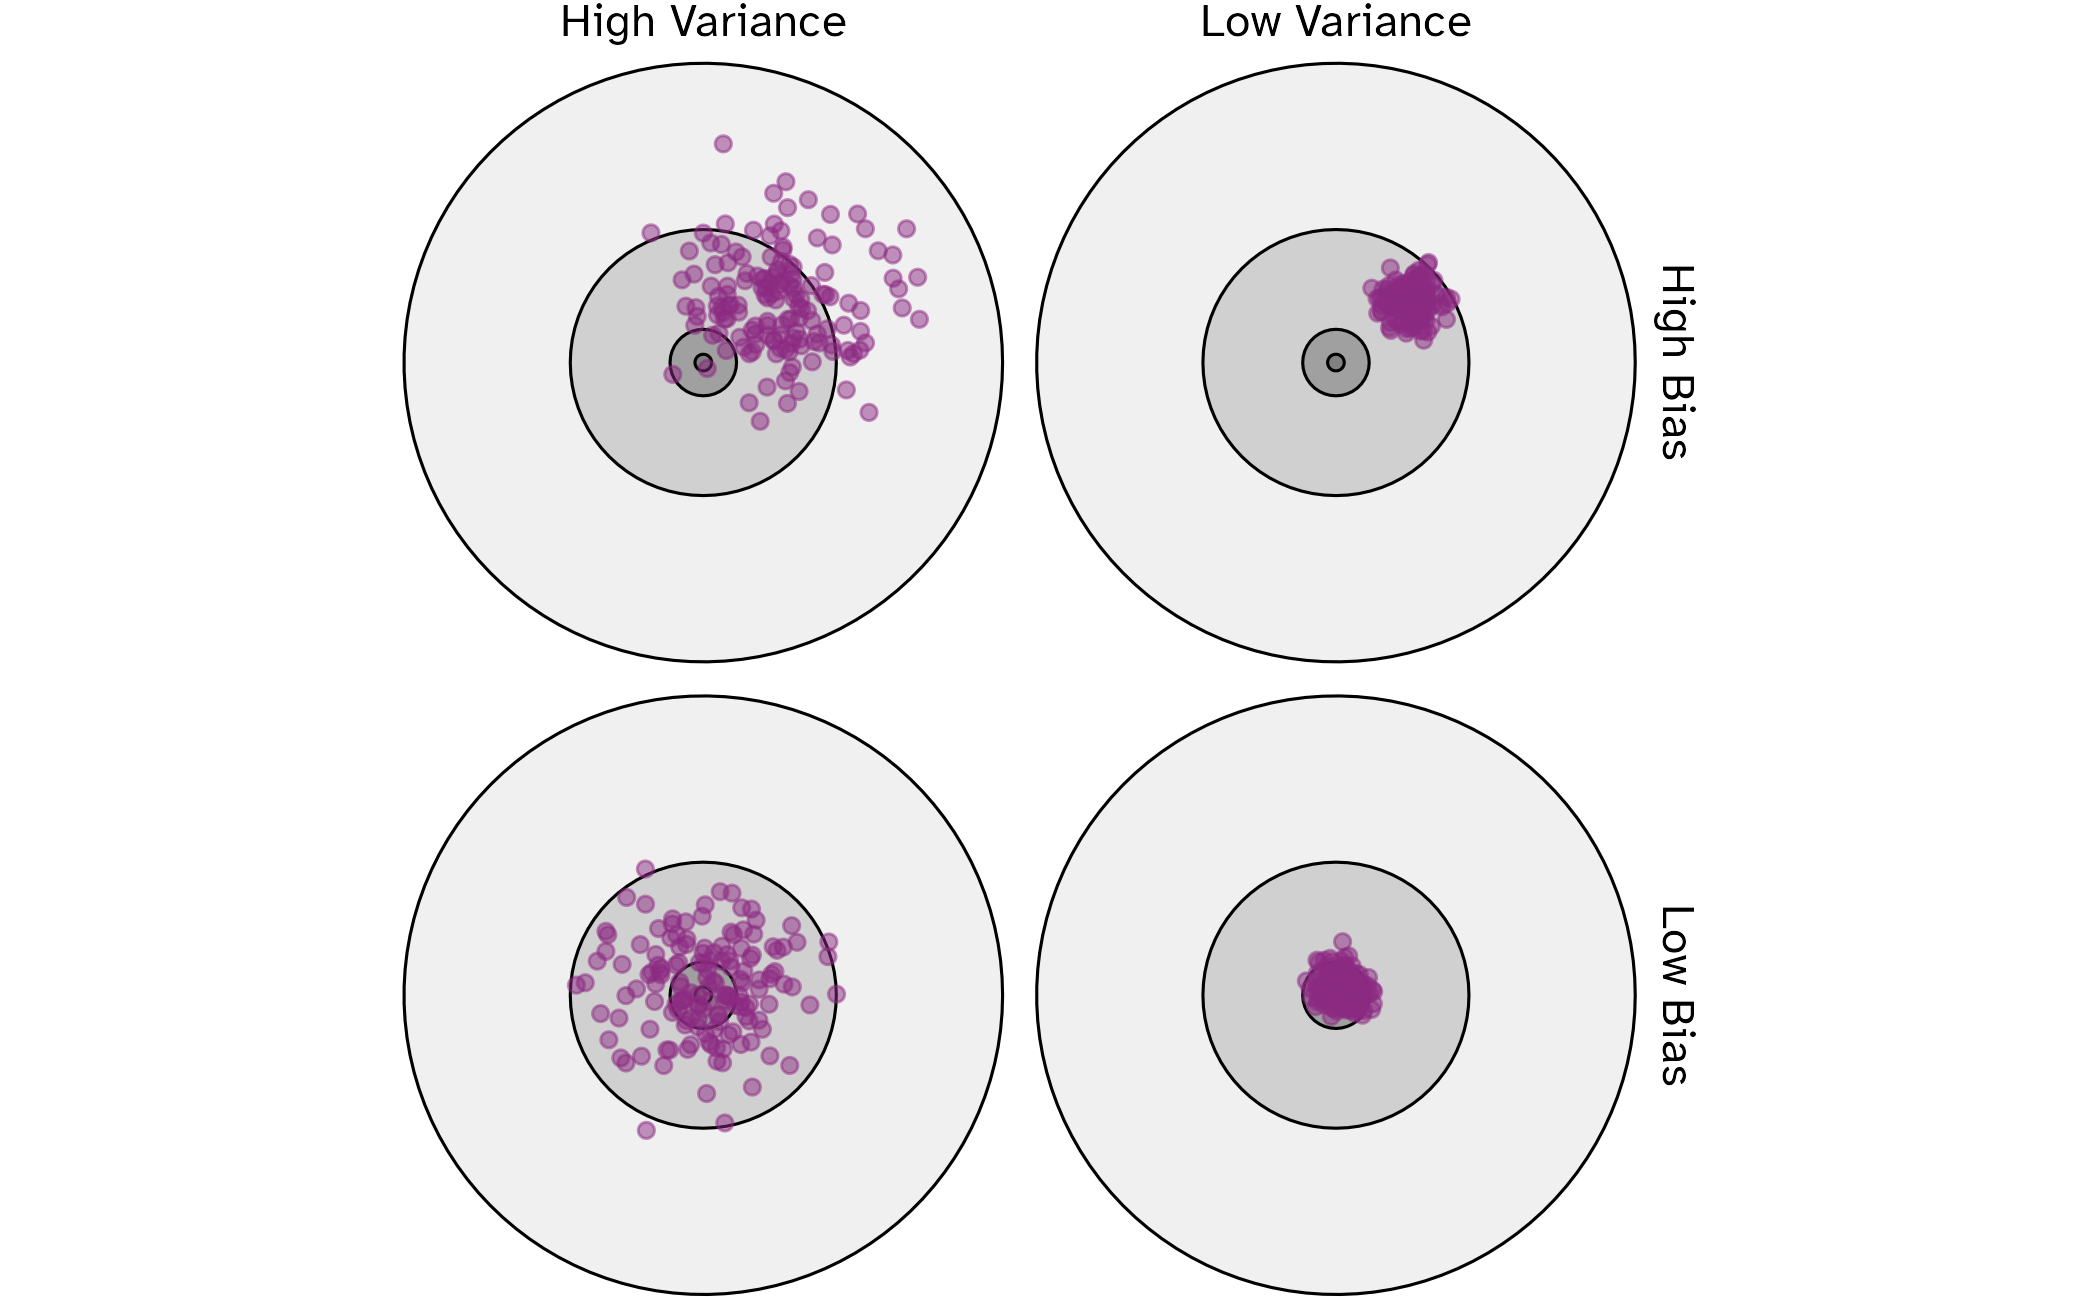
Bias vs variance
📝 Cross-validation trade-offs
Instructions
You have a dataset with 1,000 observations and are deciding between 5-fold CV and 10-fold CV. For each approach, explain:
- How many observations will be in each analysis set?
- How many observations will be in each assessment set?
- Which approach would likely give you a less biased estimate of model performance?
- Which approach would likely give you more stable (less variable) results?
- Which would you choose and why?
05:00
Selecting \(V\)
- As \(V\) increases, bias decreases and variance increases
- As \(V\) decreases, bias increases and variance decreases
- Computation time goes up with \(V\)
Common choices are \(V=5\) or \(V=10\)
Cross-validation extensions
- Repeated cross-validation: repeat the \(V\)-fold CV process multiple times with different random splits
- Reduces variance of \(V\)-fold CV by generating more resamples to average
- Monte Carlo cross-validation: randomly partition fixed \(p\) proportion of data into assessment set, but use random sampling for each fold
- Some observations may be used multiple times in the assessment set, while others may never be used
- Potentially better for smaller datasets
- Spatial cross-validation: create folds based on spatial location to account for spatial autocorrelation
Validation sets
Used when
- Original data set is very large
- Model training is very computationally expensive (e.g., deep learning)
Bootstrap resampling

Rarely used for ML model assessment, but core method for statistical inference and ensemble methods (e.g., bagging, random forests)
Image credit: Tidy modeling with R
Rolling forecasting origin resampling

Preserves temporal ordering of observations for time series data
Image credit: Tidy modeling with R
How to use resampling in ML workflows
Estimating model performance
For each \(B\) resample:
- Use the analysis set to perform all model training actions, including:
- Preprocess the data
- Apply preprocessing steps to itself
- Fit the model
- Use the assessment set to perform all model evaluation actions, including:
- Apply the preprocessing steps learned from the analysis set to the assessment set
- Generate predictions
- Calculate performance metrics
Average the performance metrics across the \(B\) models
Do I need to generate new resamples for each model?

How do I get consistently random partitions?
- Random number generators (RNGs)
- Set a random seed before partitioning
How do I get this to run faster?
Embarrassingly parallel computations
Use parallel processing to estimate models independently across resamples
Limited only by available hardware resources (CPU cores, RAM, etc.)
Resampling with {tidymodels}
Partition into training/test sets
Partition into training/test sets
# A tibble: 233 × 8
   species   island    bill_len bill_dep flipper_len body_mass sex     year
   <fct>     <fct>        <dbl>    <dbl>       <int>     <int> <fct>  <int>
 1 Gentoo    Biscoe        59.6     17           230      6050 male    2007
 2 Adelie    Torgersen     34.4     18.4         184      3325 female  2007
 3 Gentoo    Biscoe        45.2     15.8         215      5300 male    2008
 4 Chinstrap Dream         49       19.5         210      3950 male    2008
 5 Adelie    Torgersen     41.4     18.5         202      3875 male    2009
 6 Chinstrap Dream         51       18.8         203      4100 male    2008
 7 Gentoo    Biscoe        44.9     13.8         212      4750 female  2009
 8 Gentoo    Biscoe        51.1     16.5         225      5250 male    2009
 9 Chinstrap Dream         50.8     19           210      4100 male    2009
10 Gentoo    Biscoe        45.4     14.6         211      4800 female  2007
# ℹ 223 more rows# A tibble: 100 × 8
species island bill_len bill_dep flipper_len body_mass sex year
<fct> <fct> <dbl> <dbl> <int> <int> <fct> <int>
1 Adelie Torgersen 39.5 17.4 186 3800 female 2007
2 Adelie Torgersen 40.3 18 195 3250 female 2007
3 Adelie Torgersen 38.7 19 195 3450 female 2007
4 Adelie Torgersen 46 21.5 194 4200 male 2007
5 Adelie Biscoe 35.9 19.2 189 3800 female 2007
6 Adelie Biscoe 38.2 18.1 185 3950 male 2007
7 Adelie Dream 39.5 17.8 188 3300 female 2007
8 Adelie Dream 36 18.5 186 3100 female 2007
9 Adelie Dream 42.3 21.2 191 4150 male 2007
10 Adelie Biscoe 39.6 17.7 186 3500 female 2008
# ℹ 90 more rowsResample the training set
#  5-fold cross-validation repeated 5 times
# A tibble: 25 × 3
   splits           id      id2
   <list>           <chr>   <chr>
 1 <split [186/47]> Repeat1 Fold1
 2 <split [186/47]> Repeat1 Fold2
 3 <split [186/47]> Repeat1 Fold3
 4 <split [187/46]> Repeat1 Fold4
 5 <split [187/46]> Repeat1 Fold5
 6 <split [186/47]> Repeat2 Fold1
 7 <split [186/47]> Repeat2 Fold2
 8 <split [186/47]> Repeat2 Fold3
 9 <split [187/46]> Repeat2 Fold4
10 <split [187/46]> Repeat2 Fold5
# ℹ 15 more rows
Fit model to each resample
# A tibble: 2 × 6
  .metric .estimator    mean     n std_err .config
  <chr>   <chr>        <dbl> <int>   <dbl> <chr>
1 rmse    standard   321.       25 5.16    Preprocessor1_Model1
2 rsq     standard     0.847    25 0.00600 Preprocessor1_Model1
Fit model to each resample
# A tibble: 2 × 6
  .metric .estimator    mean     n std_err .config
  <chr>   <chr>        <dbl> <int>   <dbl> <chr>
1 rmse    standard   329.       25 8.06    Preprocessor1_Model1
2 rsq     standard     0.839    25 0.00866 Preprocessor1_Model1
Resampling with scikit-learn
Partition into training/test sets
import pandas as pd
import numpy as np
from sklearn.model_selection import train_test_split, RepeatedKFold, cross_validate
from sklearn.neighbors import KNeighborsRegressor
from sklearn.tree import DecisionTreeRegressor
from sklearn.metrics import mean_squared_error, r2_score
from palmerpenguins import load_penguins

np.random.seed(123)

penguins = load_penguins().dropna()

X = penguins.drop(["body_mass_g", "species", "island", "sex"], axis=1)
y = penguins["body_mass_g"]

X_train, X_test, y_train, y_test = train_test_split(
    X, y, test_size=0.3
)

X_train.shape
(233, 4)(100, 4)Resample the training set
Fit model to each resample
knn_model = KNeighborsRegressor(n_neighbors=5)

knn_cv_results = cross_validate(
    estimator=knn_model,
    X=X_train,
    y=y_train,
    cv=cv,
    scoring={"neg_root_mean_squared_error": "neg_root_mean_squared_error", "r2": "r2"},
    return_train_score=False,
)

knn_rmse_scores = -knn_cv_results["test_neg_root_mean_squared_error"]
knn_r2_scores = knn_cv_results["test_r2"]

knn_metrics = pd.DataFrame(
    {
        "metric": ["rmse", "rsq"],
        "estimator": ["standard", "standard"],
        "mean": [knn_rmse_scores.mean(), knn_r2_scores.mean()],
        "n": [len(knn_rmse_scores), len(knn_r2_scores)],
        "std_err": [
            knn_rmse_scores.std() / np.sqrt(len(knn_rmse_scores)),
            knn_r2_scores.std() / np.sqrt(len(knn_r2_scores)),
        ],
    }
)

knn_metrics
metric estimator mean n std_err
0 rmse standard 348.551212 25 5.207057
1 rsq standard 0.799162 25 0.008655Fit model to each resample
tree_model = DecisionTreeRegressor()

tree_cv_results = cross_validate(
    estimator=tree_model,
    X=X_train,
    y=y_train,
    cv=cv,
    scoring={"neg_root_mean_squared_error": "neg_root_mean_squared_error", "r2": "r2"},
    return_train_score=False,
)

tree_rmse_scores = -tree_cv_results["test_neg_root_mean_squared_error"]
tree_r2_scores = tree_cv_results["test_r2"]

tree_metrics = pd.DataFrame(
    {
        "metric": ["rmse", "rsq"],
        "estimator": ["standard", "standard"],
        "mean": [tree_rmse_scores.mean(), tree_r2_scores.mean()],
        "n": [len(tree_rmse_scores), len(tree_r2_scores)],
        "std_err": [
            tree_rmse_scores.std() / np.sqrt(len(tree_rmse_scores)),
            tree_r2_scores.std() / np.sqrt(len(tree_r2_scores)),
        ],
    }
)

tree_metrics
metric estimator mean n std_err
0 rmse standard 470.879978 25 11.425615
1 rsq standard 0.633047 25 0.018241Wrap-up
Recap
- Data partitioning is essential to avoid overfitting and ensure reliable model evaluation
- Resampling methods like cross-validation help estimate model performance while minimizing bias
- Avoid information leakage by carefully timing data splits and preprocessing steps