 [1] "avg_price_per_room"             "lead_time"
 [3] "stays_in_weekend_nights"        "stays_in_week_nights"
 [5] "adults"                         "children"
 [7] "babies"                         "meal"
 [9] "country"                        "market_segment"
[11] "distribution_channel"           "is_repeated_guest"
[13] "previous_cancellations"         "previous_bookings_not_canceled"
[15] "reserved_room_type"             "assigned_room_type"
[17] "booking_changes"                "agent"
[19] "company"                        "days_in_waiting_list"
[21] "customer_type"                  "required_car_parking_spaces"
[23] "total_of_special_requests"      "arrival_date"
[25] "near_christmas" "near_new_years" Build better data (I)
Lecture 5
Dr. Benjamin Soltoff
Cornell University
INFO 4940/5940 - Fall 2025
September 9, 2025
Announcements
Announcements
- Homework 1 due on Wednesday by 11:59pm
- Office hours schedule
Learning objectives
- Identify the importance of preparing predictors for a machine learning model
- Distinguish between data preprocessing and feature engineering
- Demonstrate the usage of pipelines for preparing data
Hotel reservations
Hotel data
We’ll use data on hotels to predict the cost of a room
Data spending
Let’s split the data into a training set (75%) and testing set (25%) using stratification:
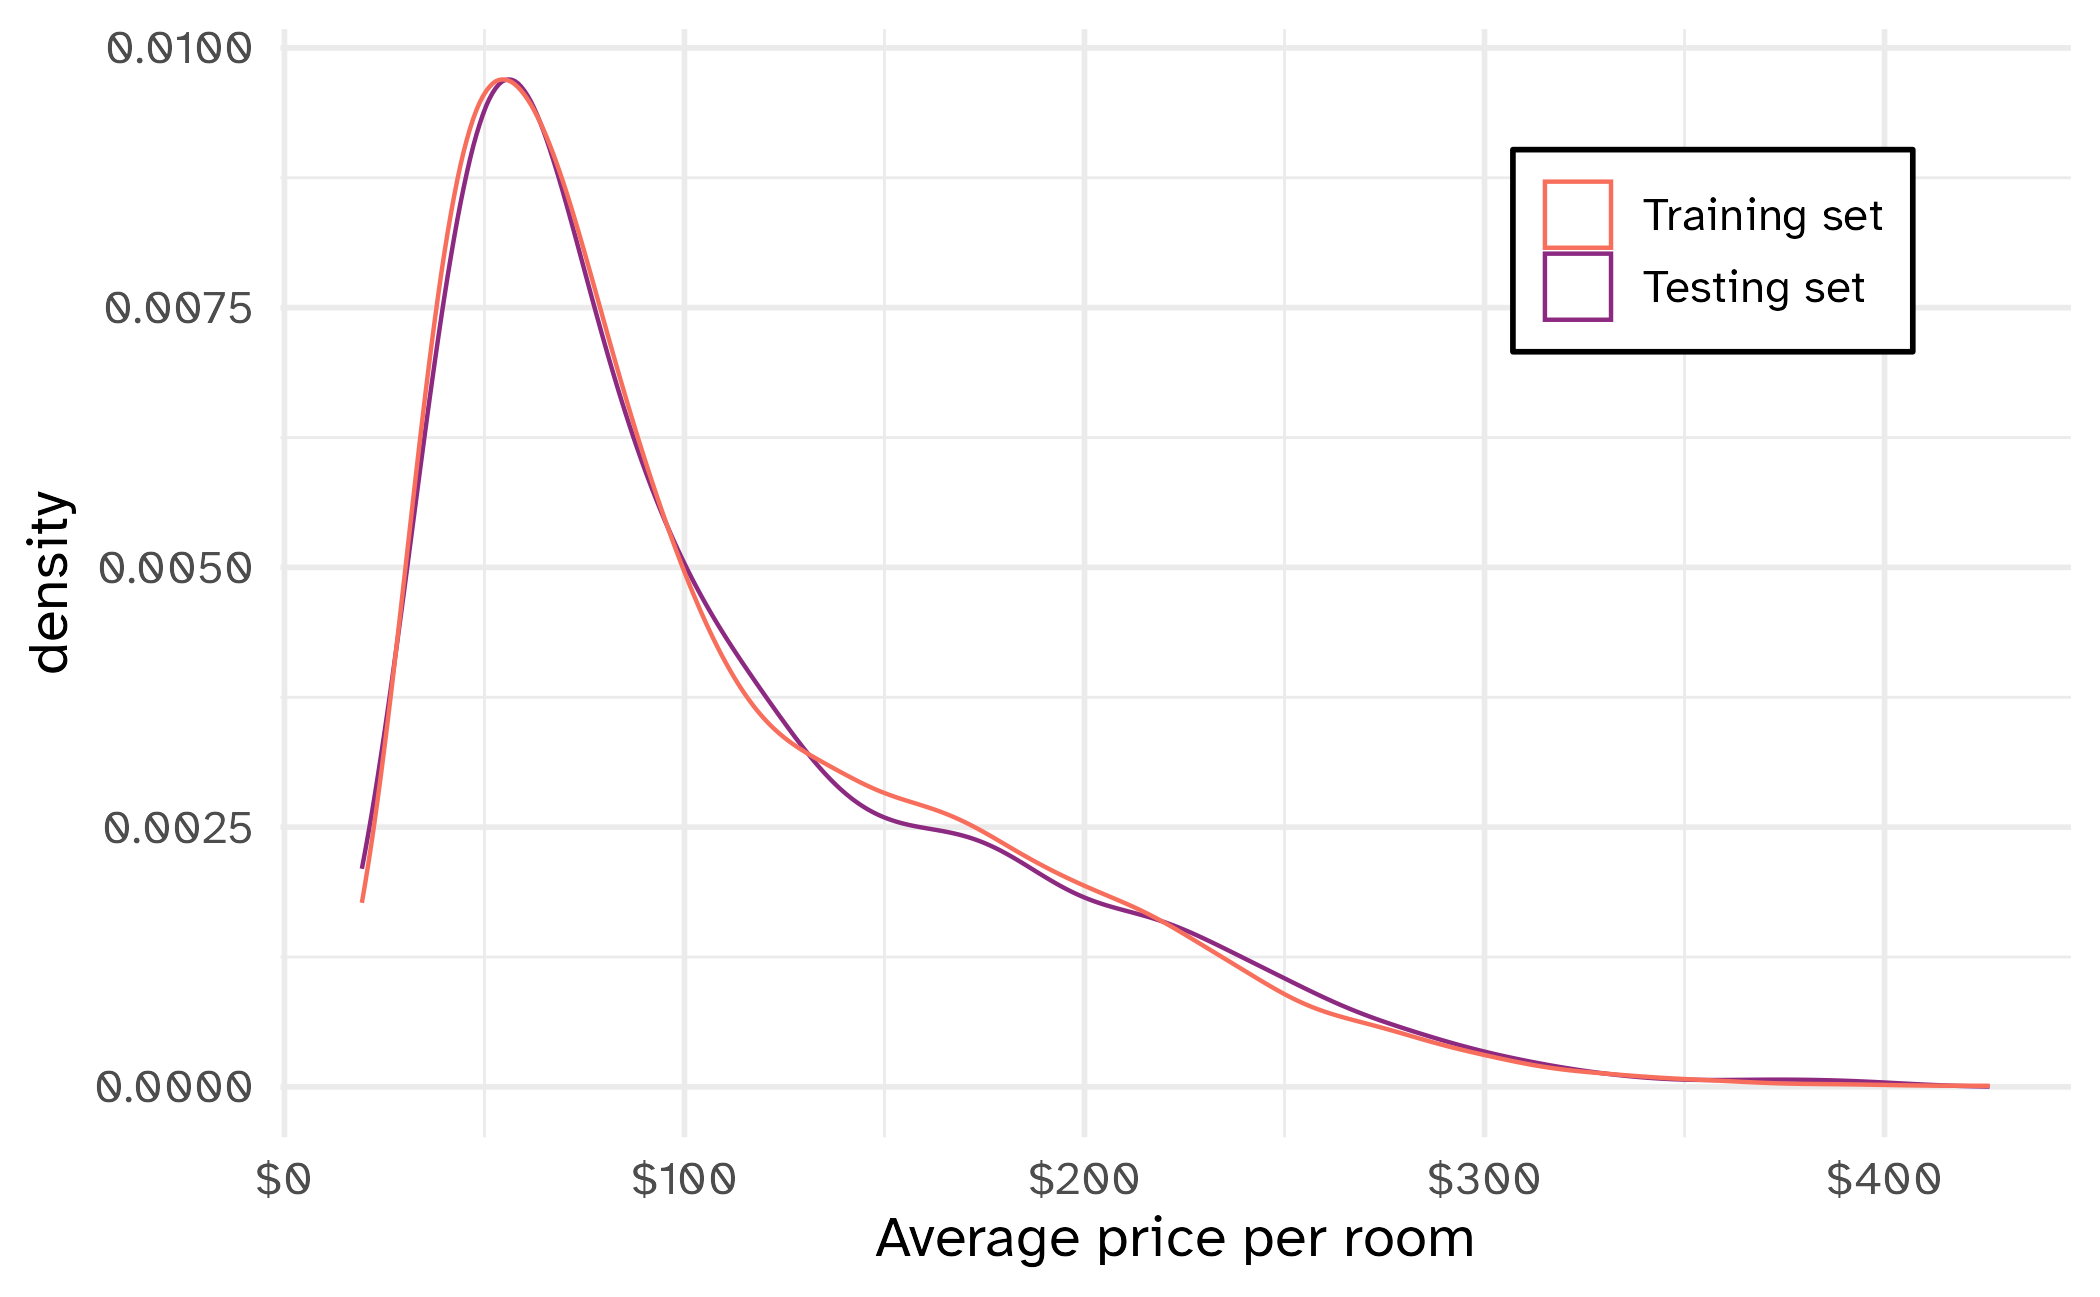
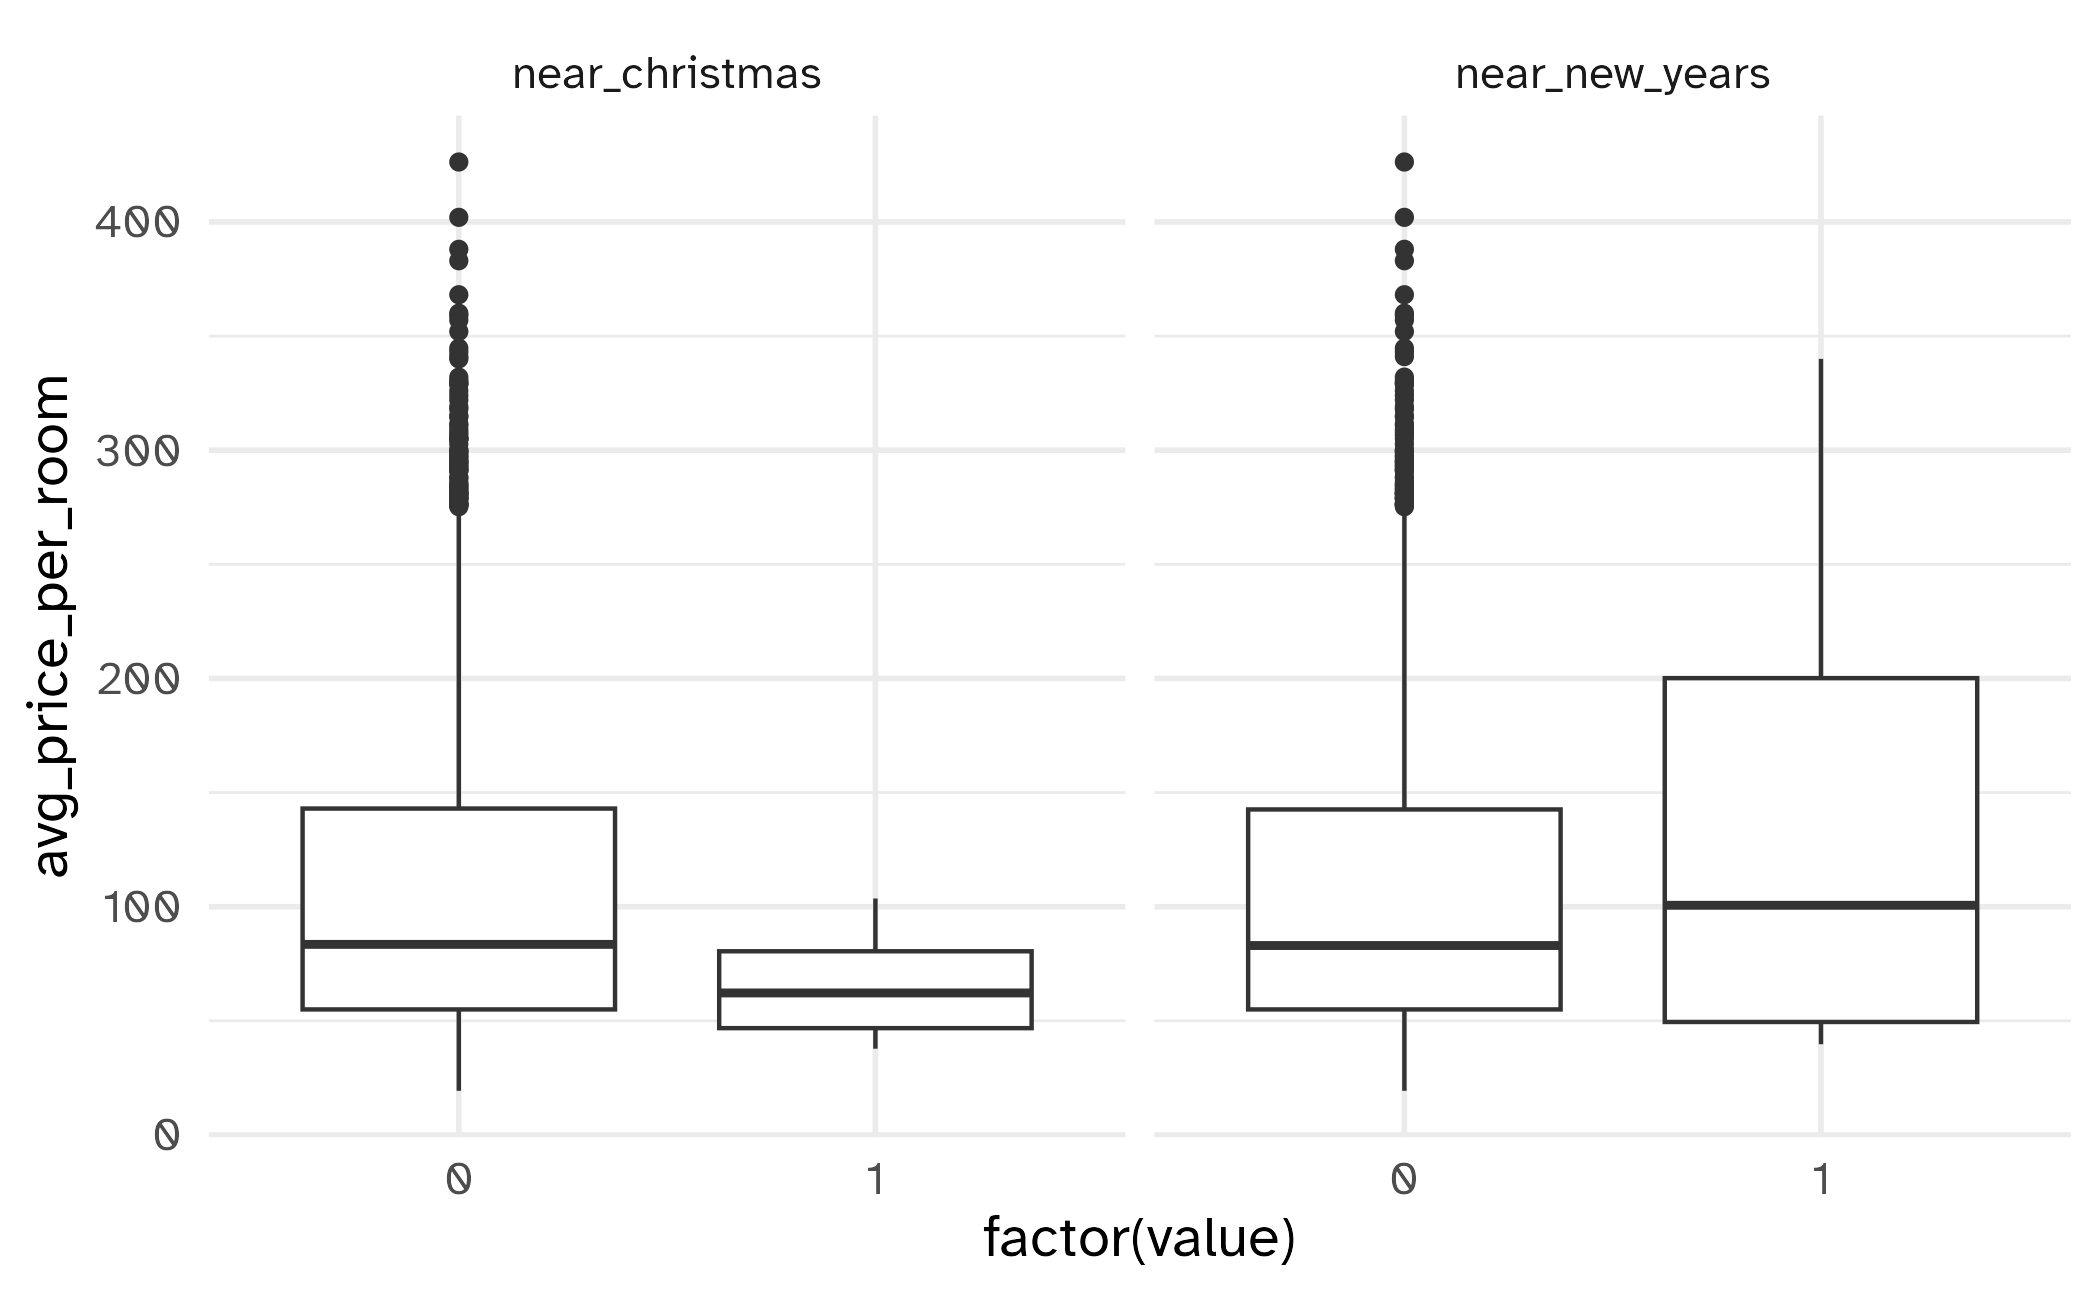
Exploratory analysis
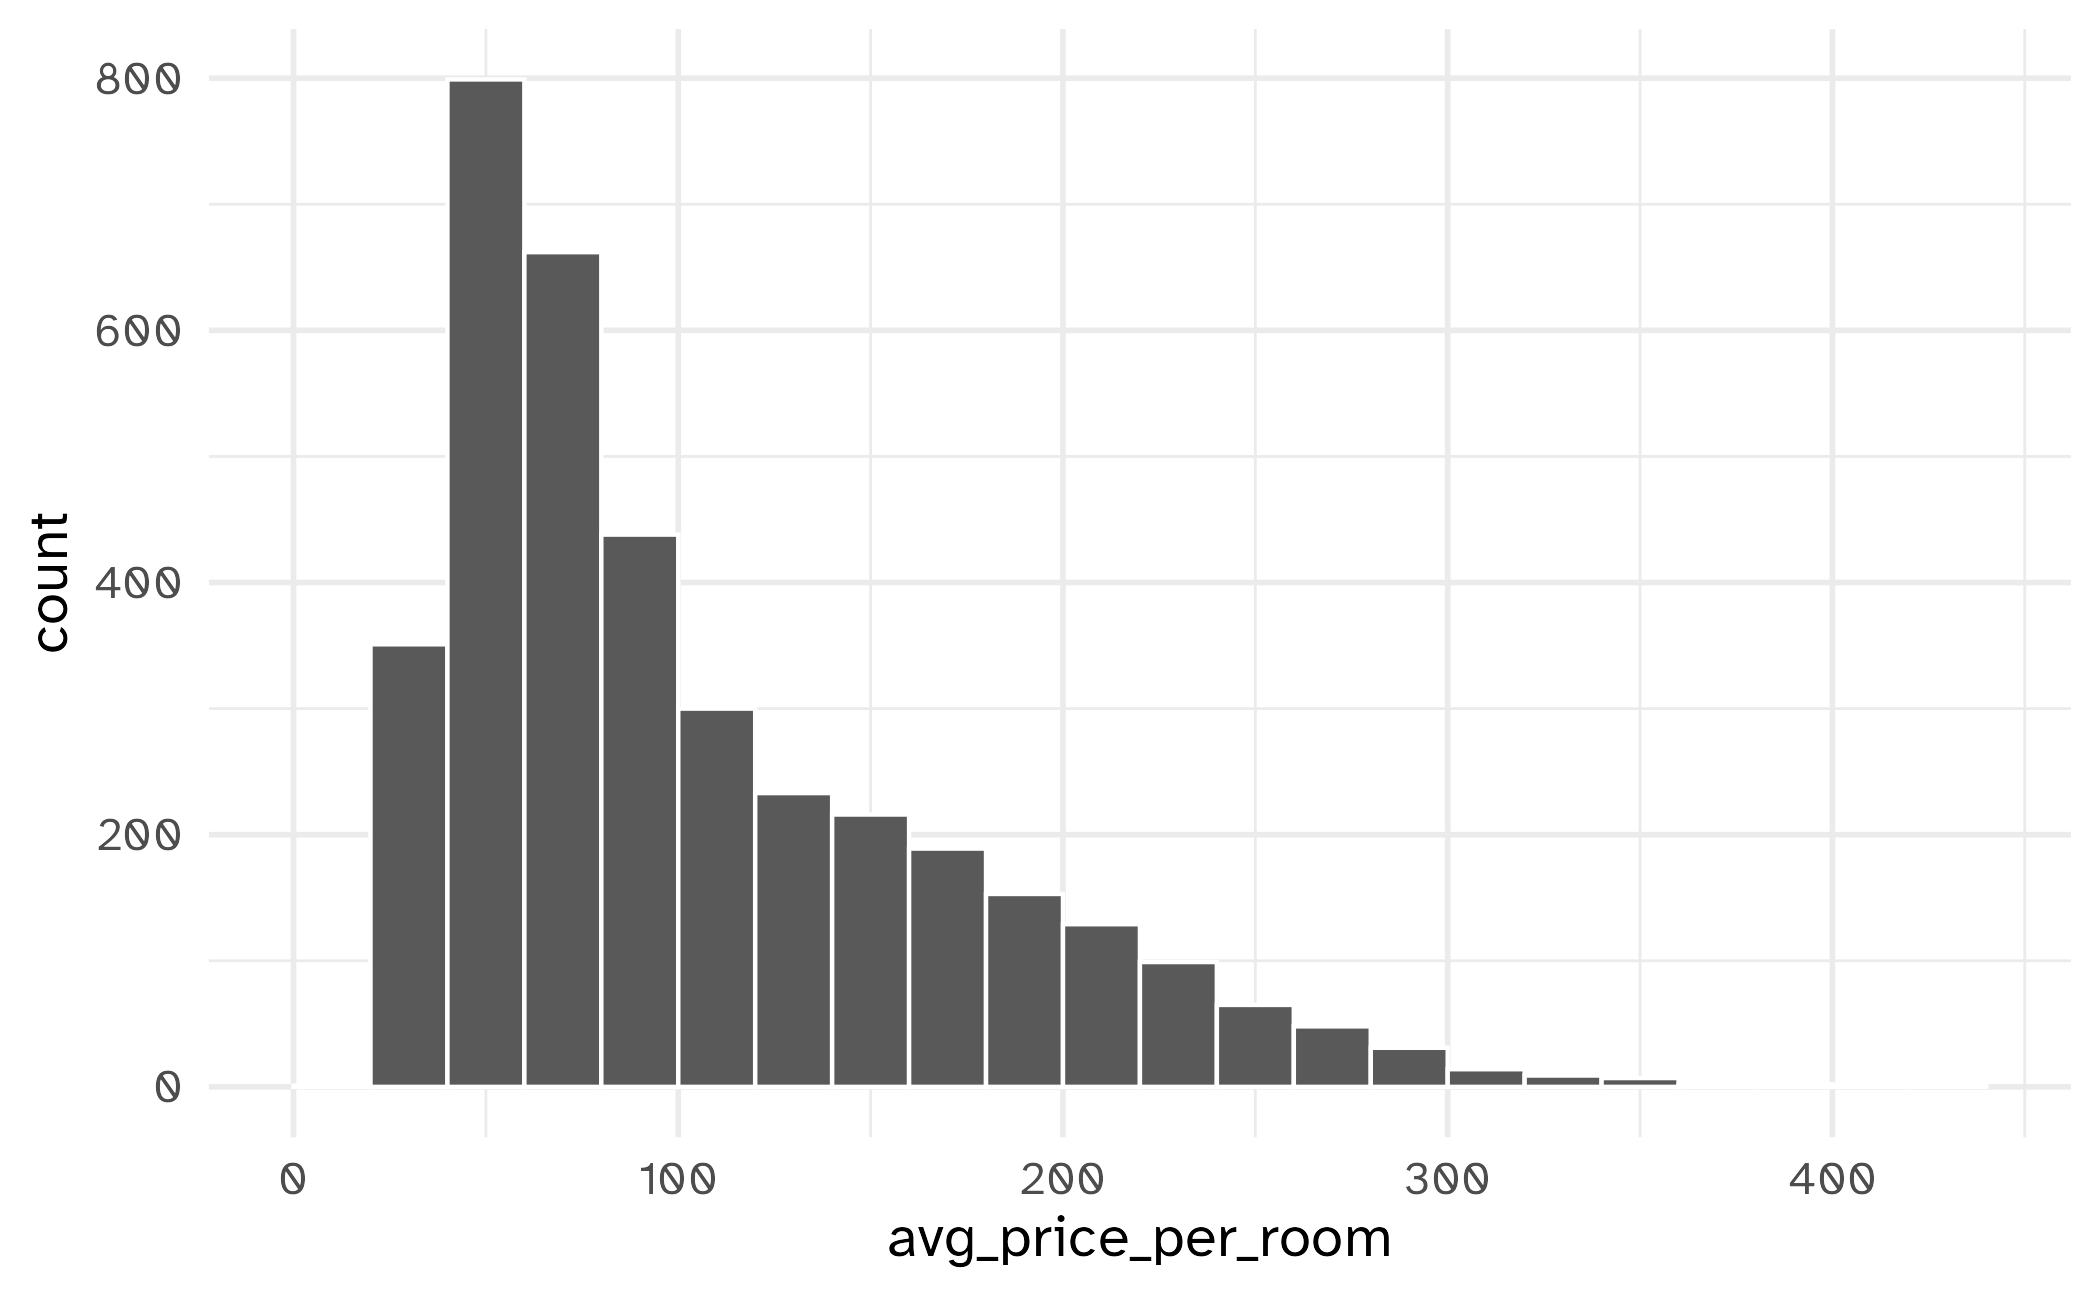
Exploratory analysis
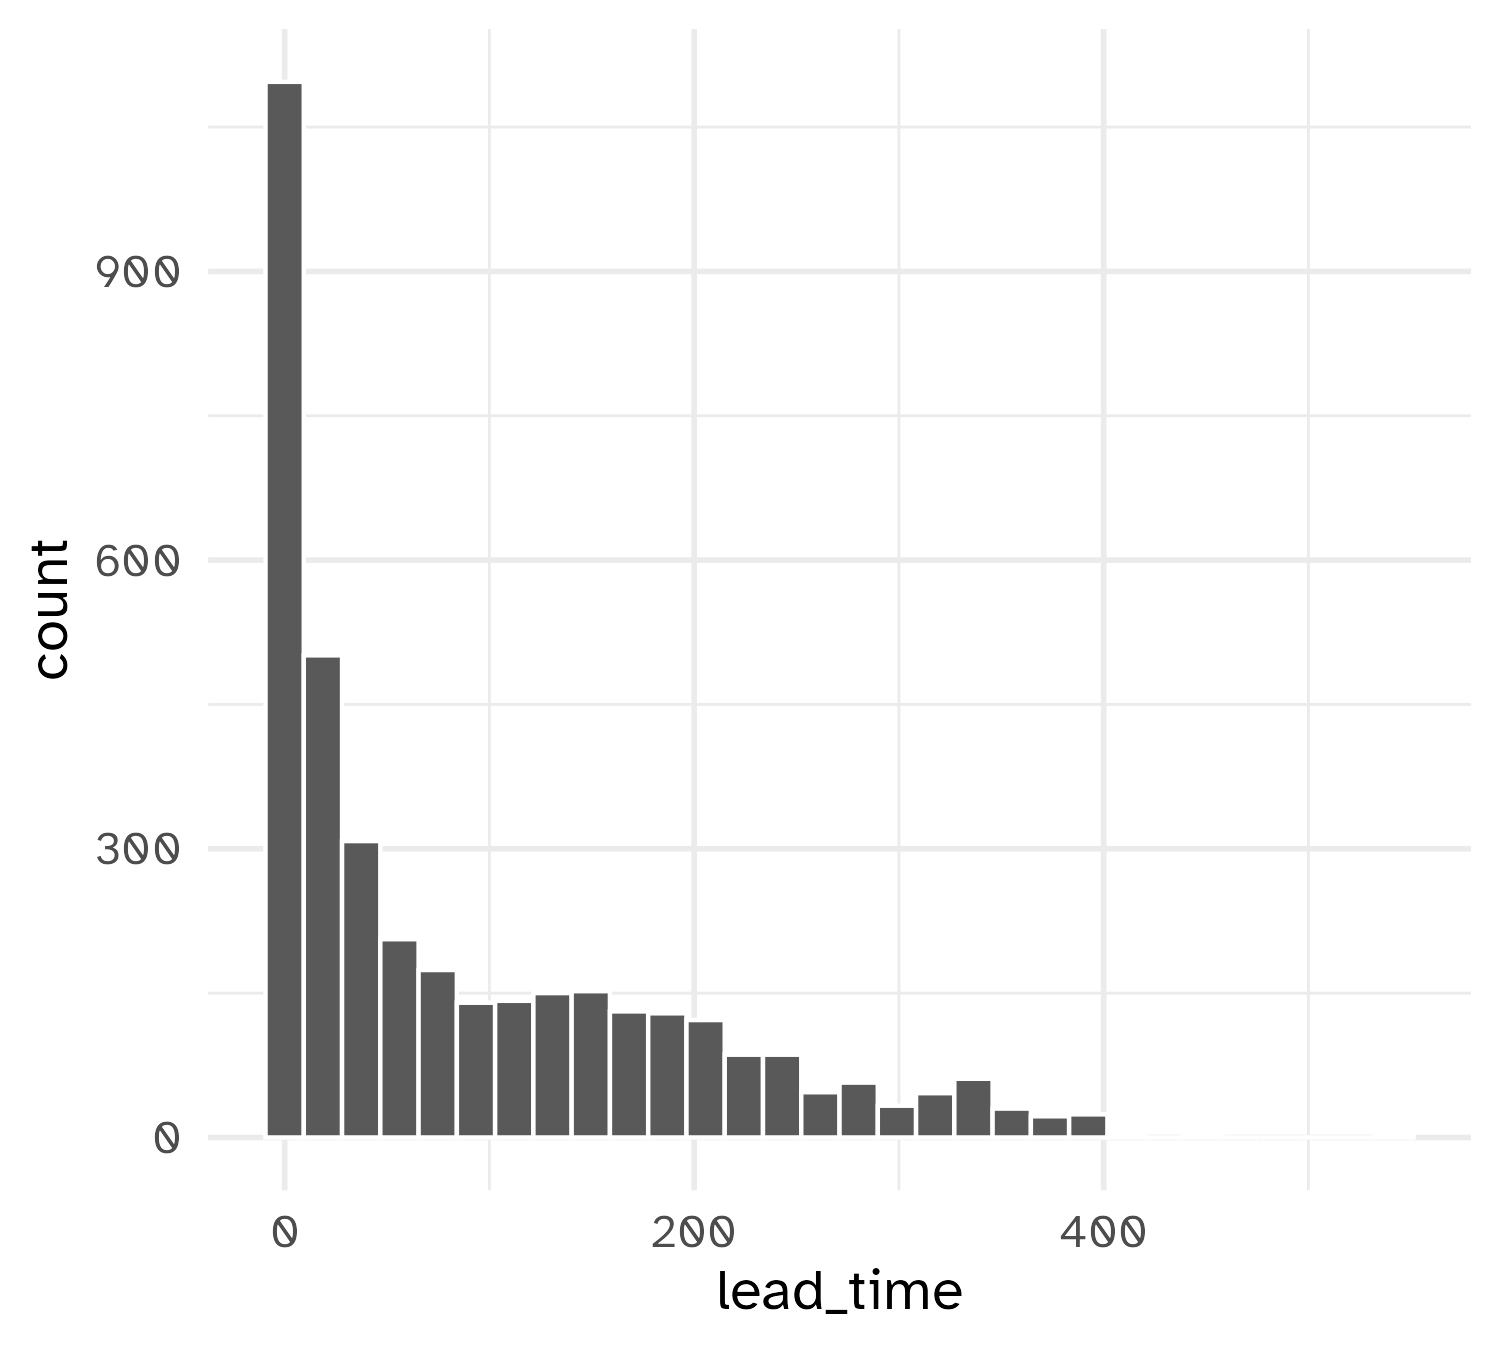
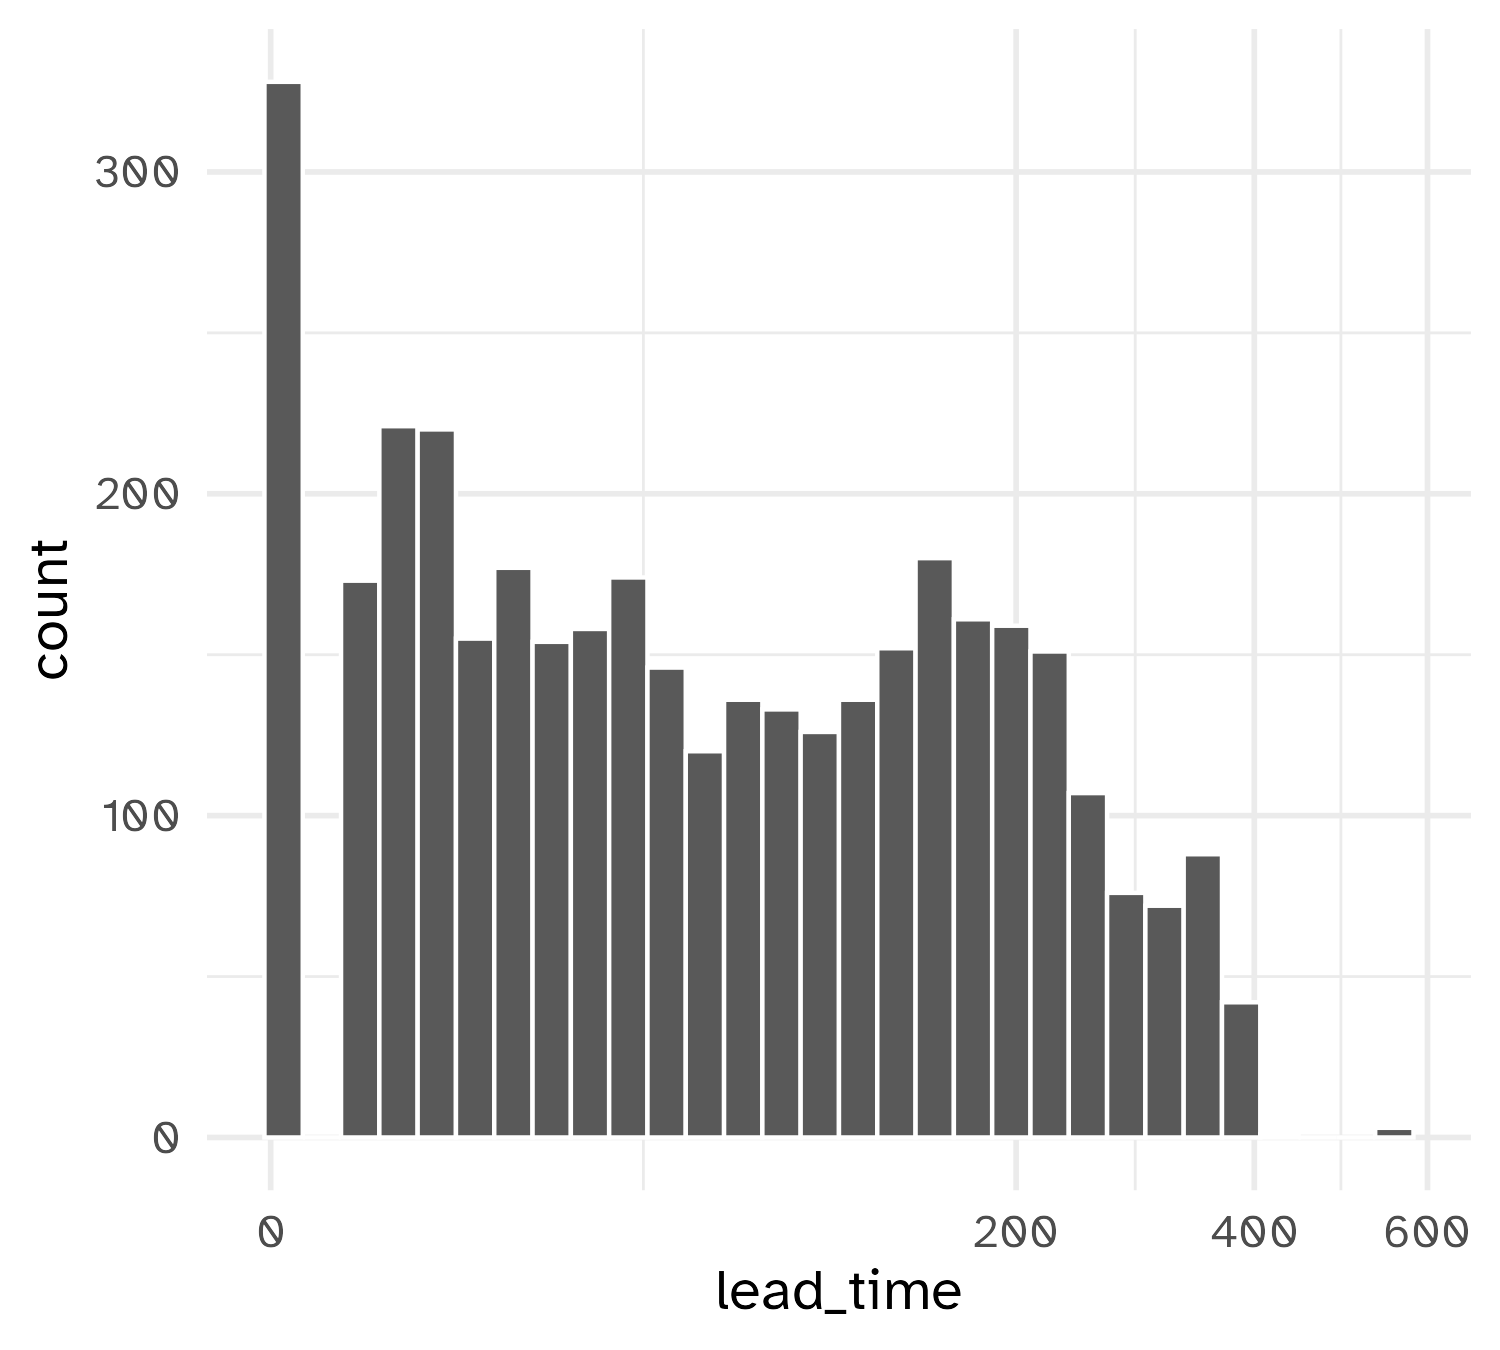
Exploratory analysis
Working with predictors
Working with predictors
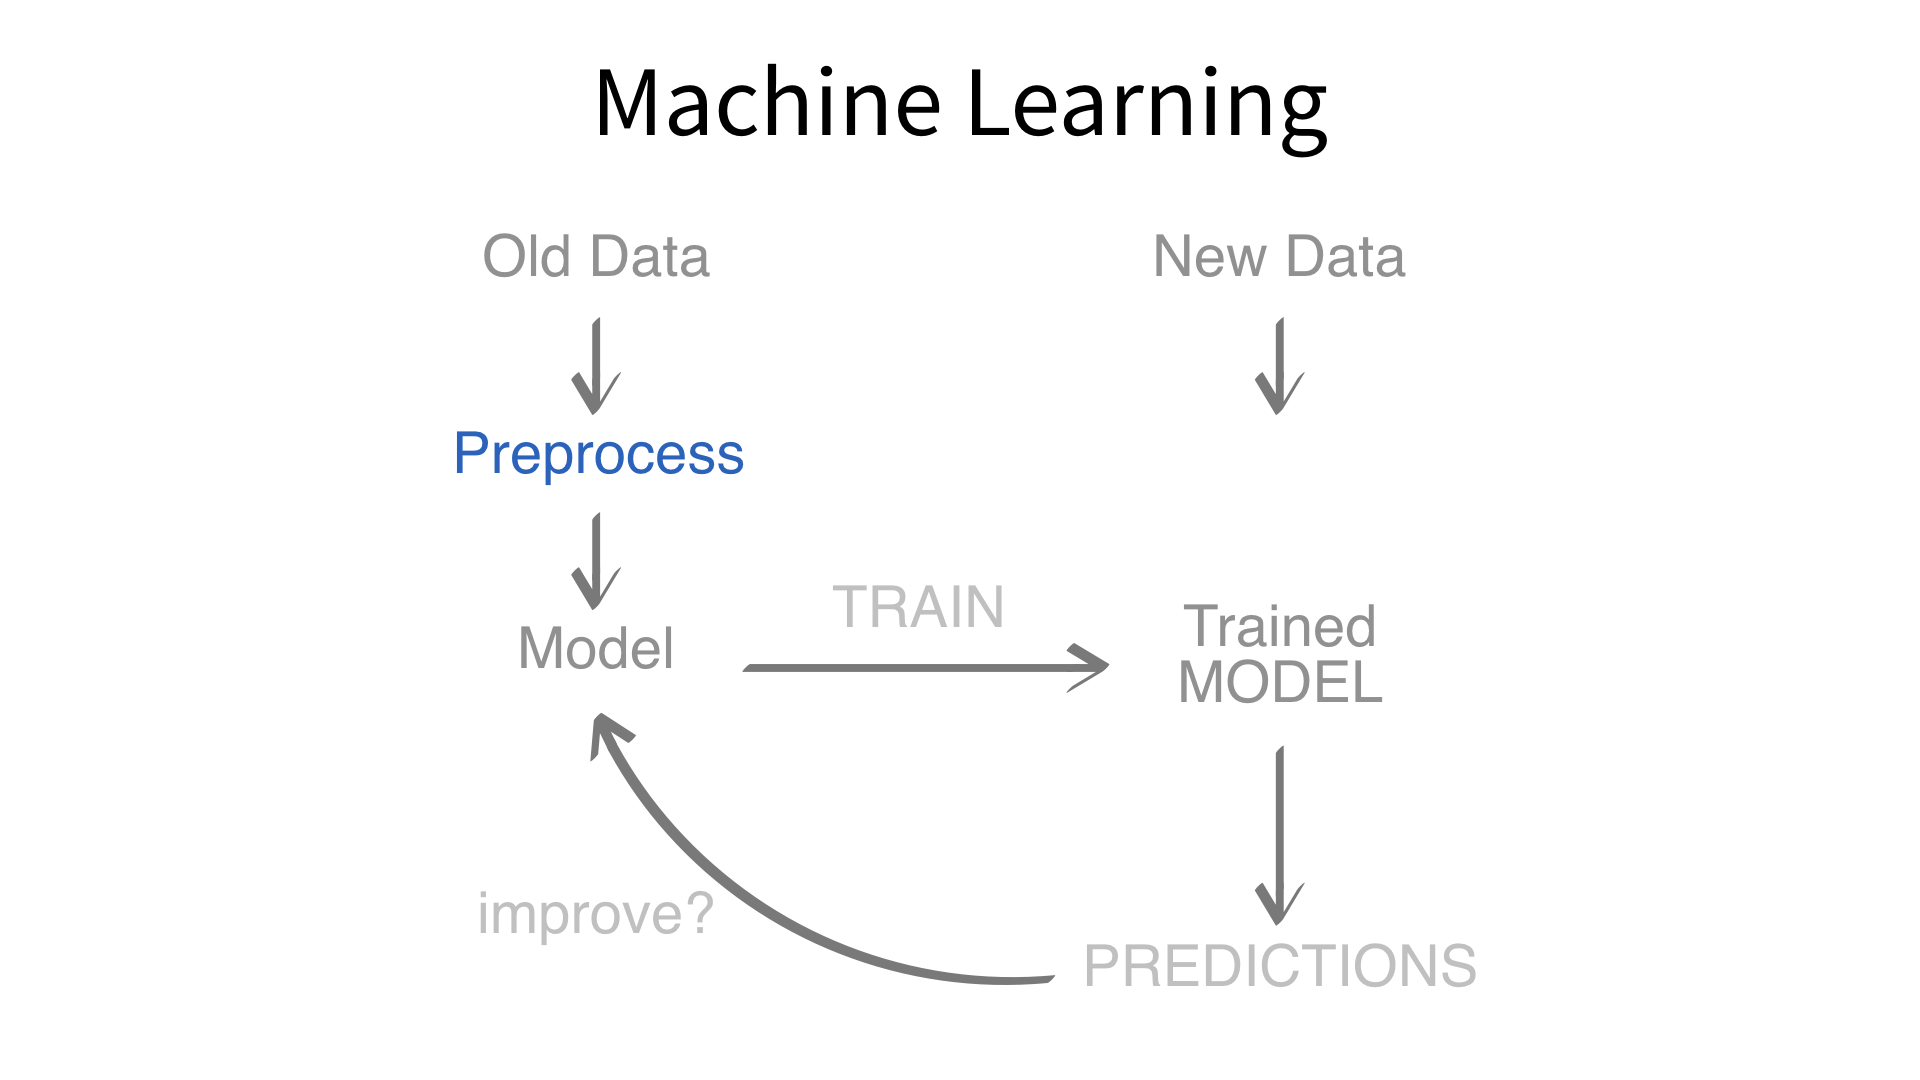
We might want to modify our predictors columns for a few reasons:
- The model requires them in a different format (e.g. dummy variables for linear regression)
- The model needs certain data qualities (e.g. same units for K-NN)
- The outcome is better predicted when one or more columns are transformed in some way (a.k.a “feature engineering”)
What is feature engineering?
Think of a feature as some representation of a predictor that will be used in a model
Example representations:
- Interactions
- Polynomial expansions/splines
- Principal component analysis (PCA) feature extraction
Example: Dates
How can we represent date columns for our model?
Most models can’t handle date columns directly, either throwing errors or converting them to integers.
We can re-engineer it as:
- Days since a reference date
- Day of the week
- Month
- Year
- Indicators for holidays
📝 How should we handle dates for this predictive task?
Instructions
Identify at least four ways to represent the arrival_date column that would potentially be useful for predicting avg_price_per_room.
05:00
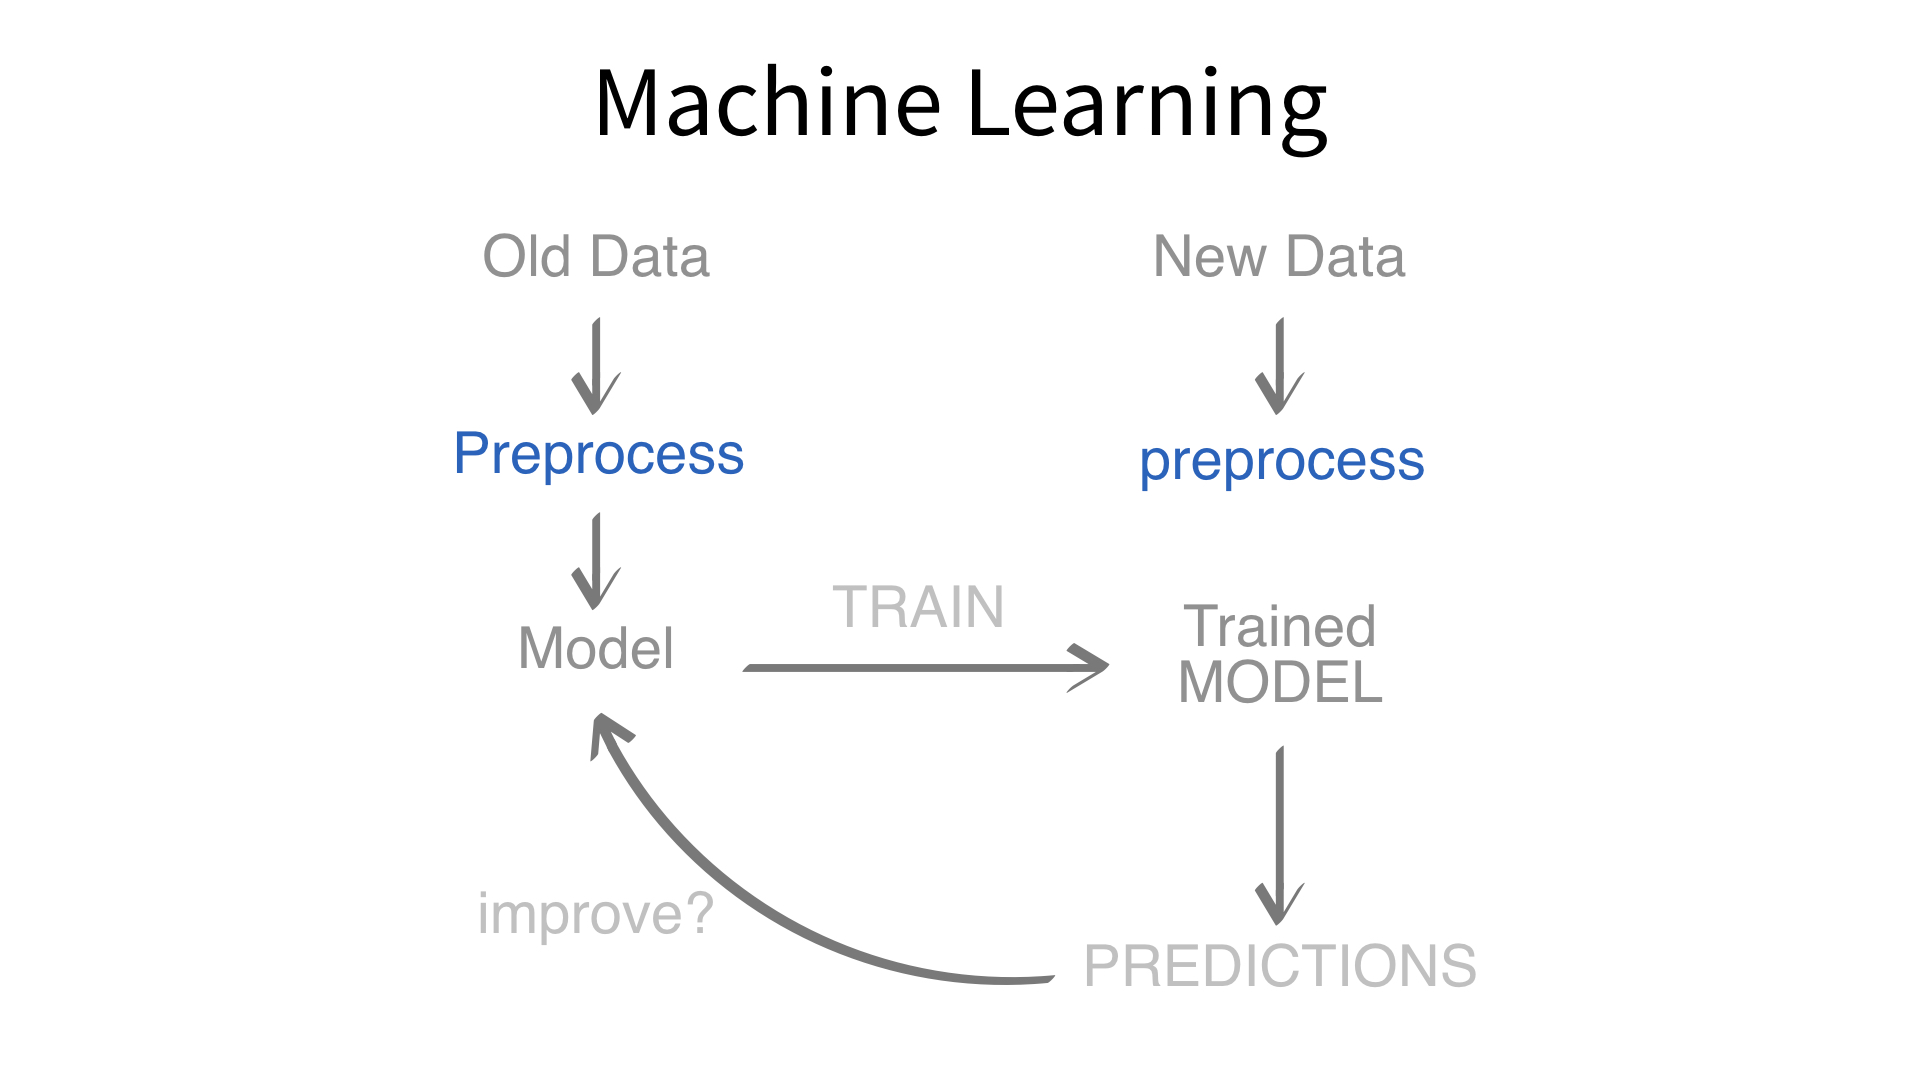
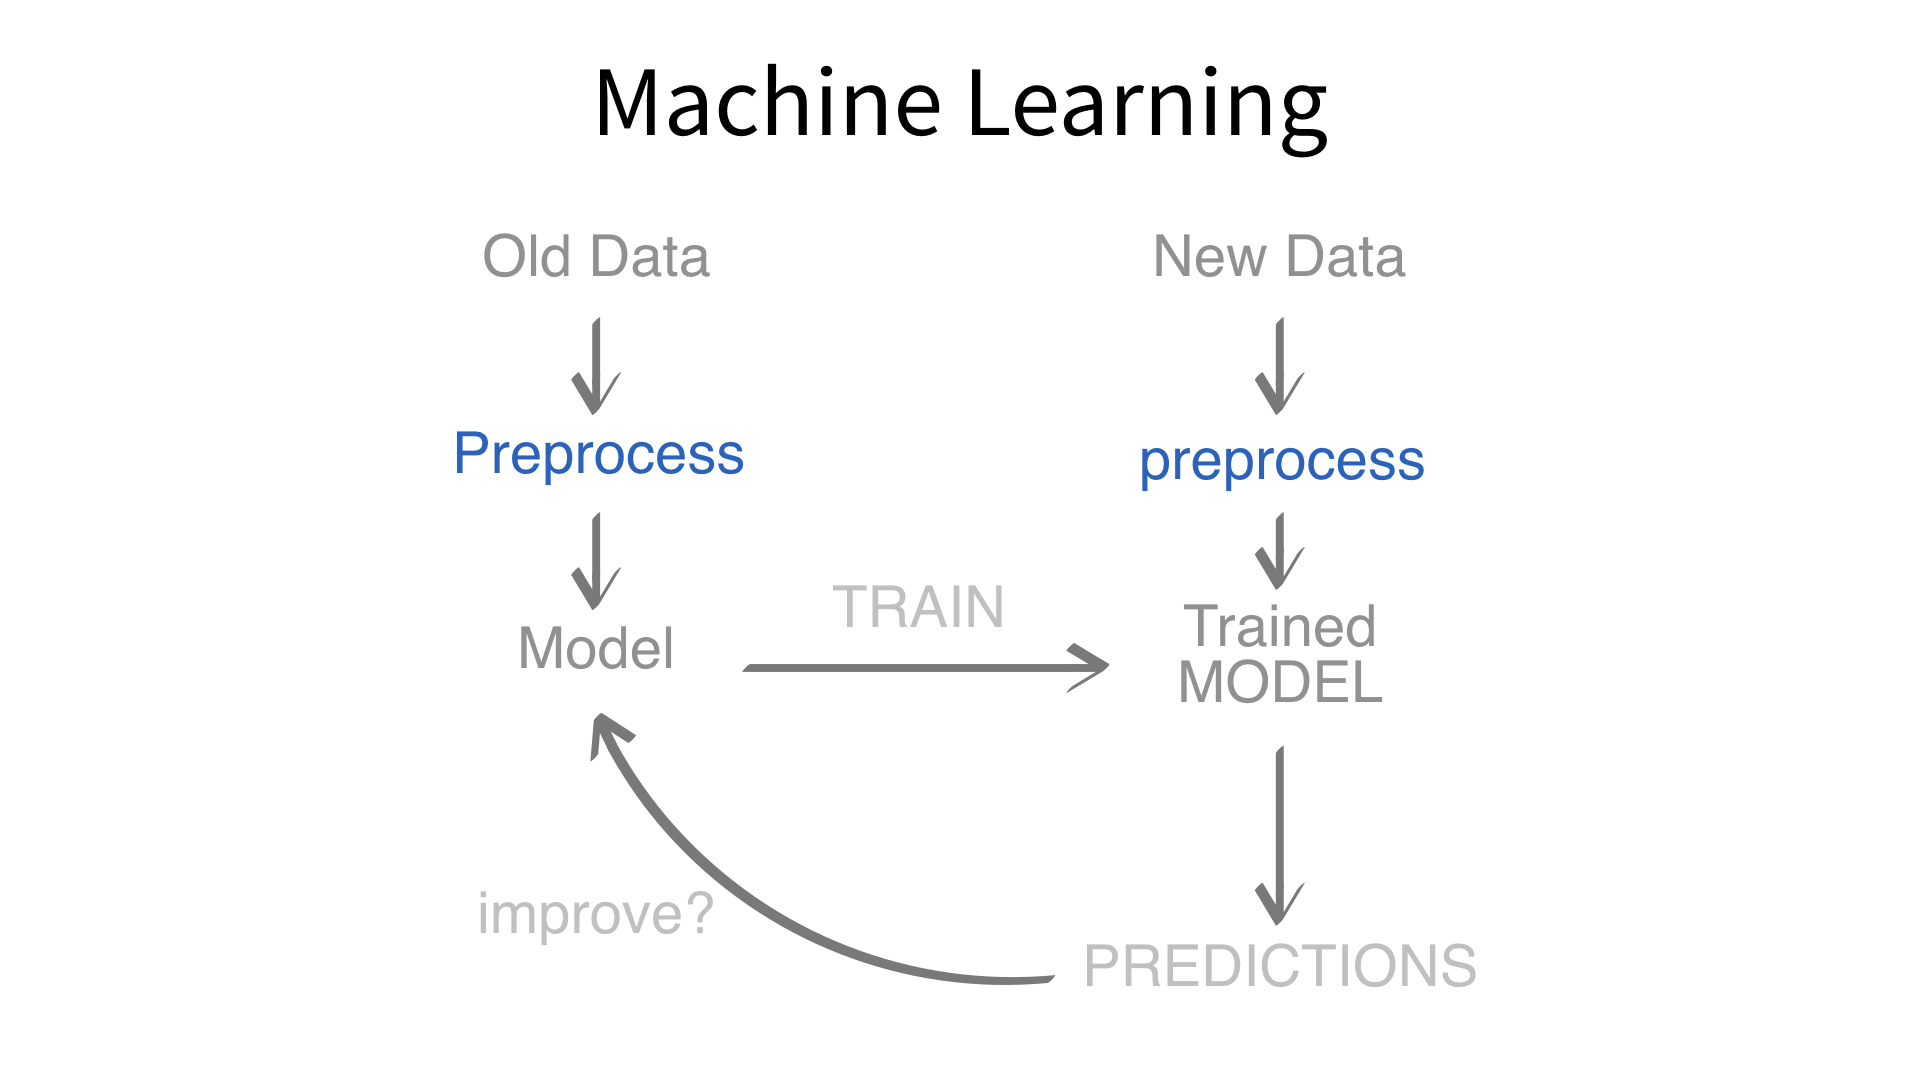
General definitions
Data preprocessing steps allow your model to fit
Feature engineering steps help the model do the least work to predict the outcome as well as possible
Resampling Strategy
Resampling Strategy
We’ll use simple 10-fold cross-validation (stratified sampling):
# 10-fold cross-validation using stratification
# A tibble: 10 × 2
splits id
<list> <chr>
1 <split [3372/377]> Fold01
2 <split [3373/376]> Fold02
3 <split [3373/376]> Fold03
4 <split [3373/376]> Fold04
5 <split [3373/376]> Fold05
6 <split [3374/375]> Fold06
7 <split [3375/374]> Fold07
8 <split [3376/373]> Fold08
9 <split [3376/373]> Fold09
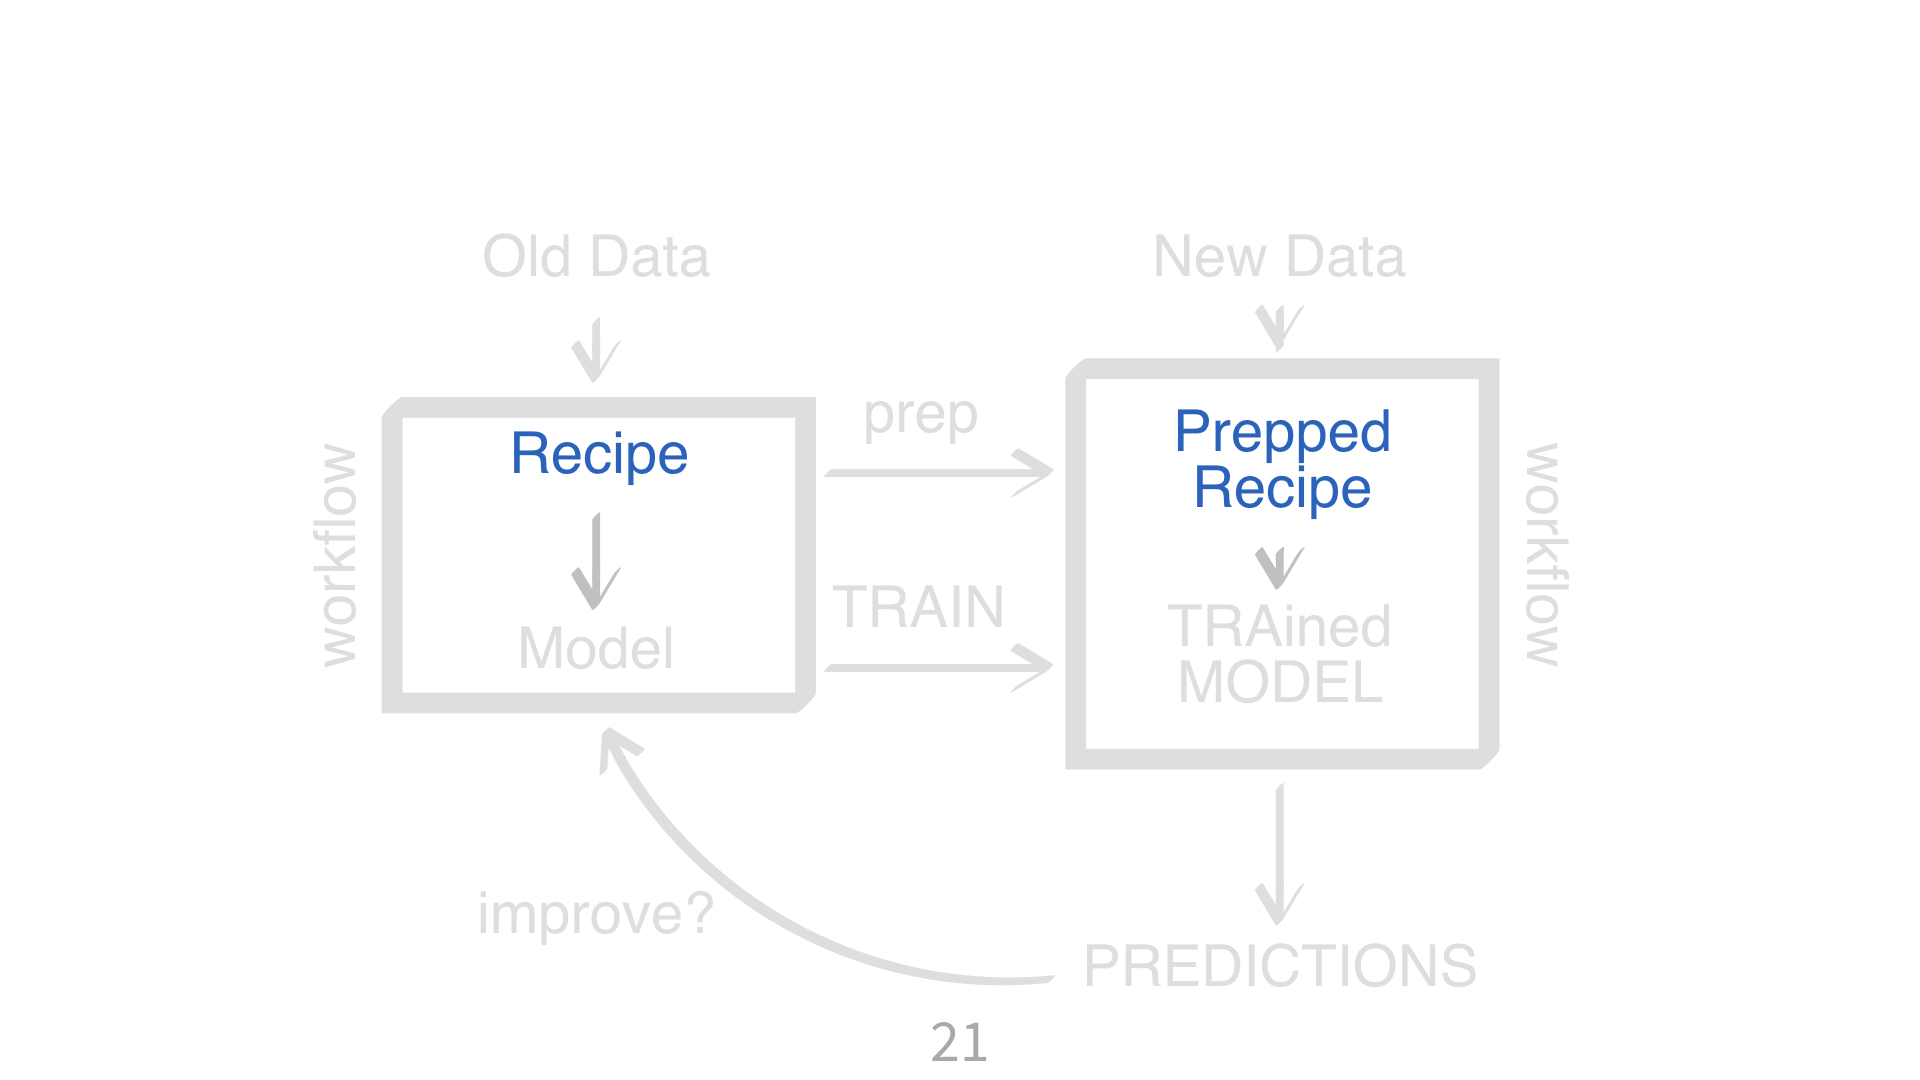
10 <split [3376/373]> Fold10Prepare your data for modeling
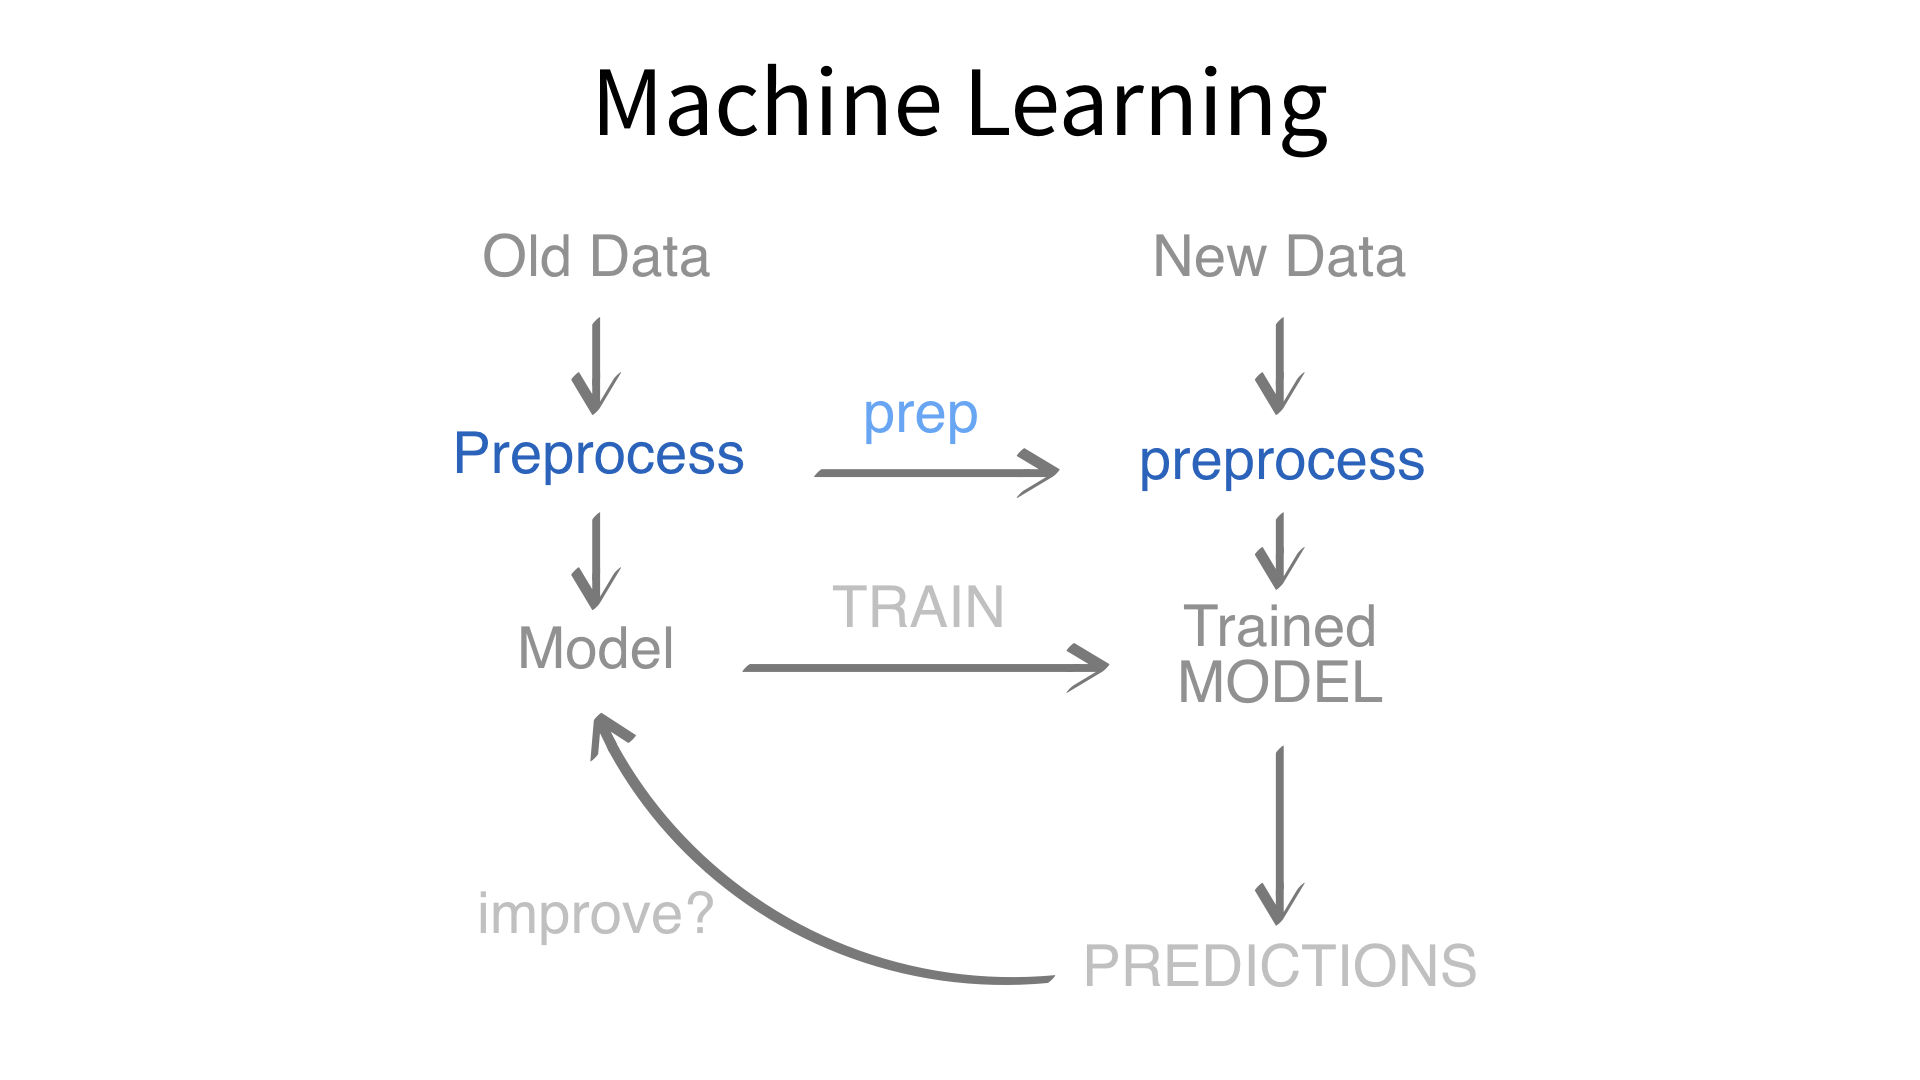
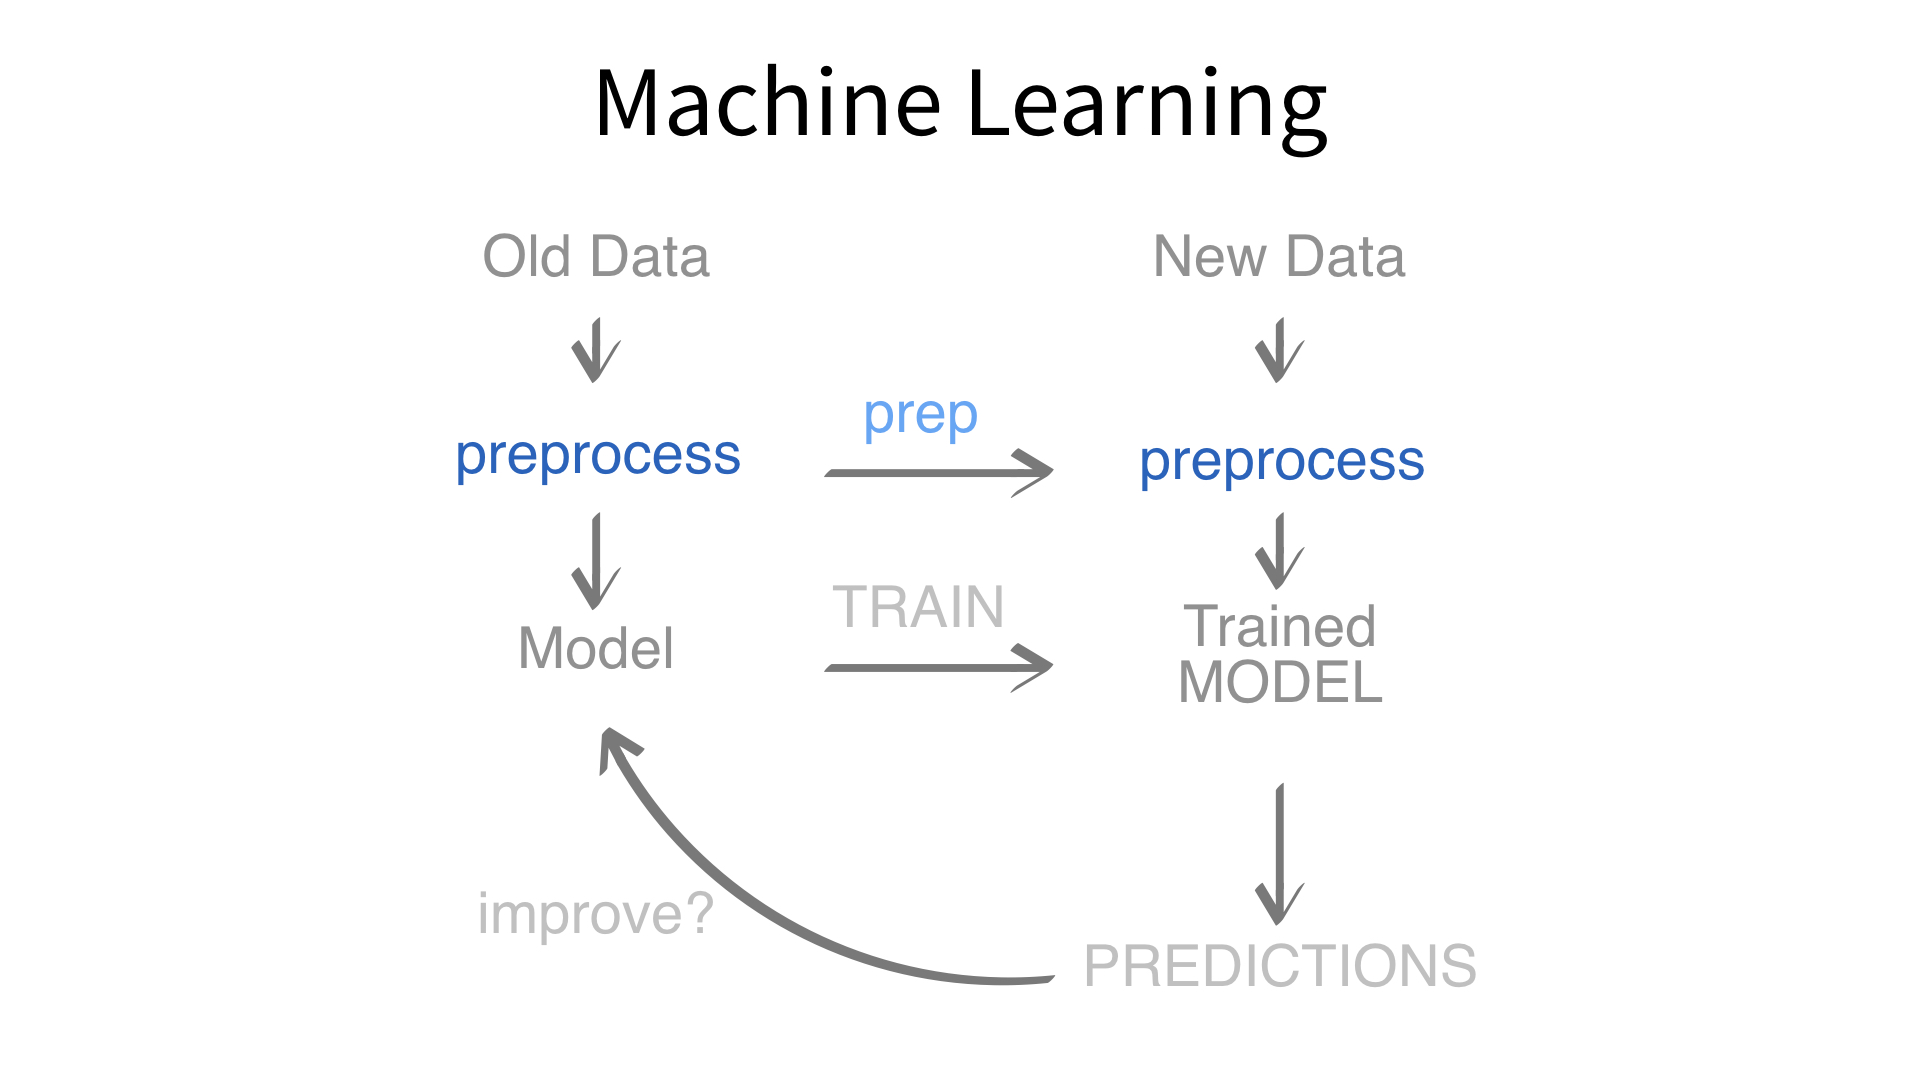
- Create pipeable (chainable) sequences of data preprocessing and feature engineering steps
- Statistical parameters for the steps can be estimated from an initial data set and then applied to other data sets
- The resulting processed output can be used as inputs for statistical or machine learning models
- In R, use the {recipes} package from the {tidymodels} ecosystem
scikit-learn provides Pipeline and ColumnTransformer to create reusable sequences of data transformations.
A first recipe
The recipe() function assigns columns to roles of “outcome” or “predictor” using the formula
- Use
ColumnTransformerto define a sequence of transformations for different columns. scikit-learnrequires predictors and outcomes to be passed as separate objects.
Create indicator variables
Create indicator variables
For any categorical predictors, make binary indicators
There are many recipe steps that can convert categorical predictors to numeric columns
step_dummy()records the levels of the categorical predictors in the training set
Before recipe
# A tibble: 4 × 1
  meal
  <chr>
1 Bed and Breakfast
2 breakfast and one other meal
3 no meal package
4 breakfast lunch and dinner
After recipe
# A tibble: 4 × 3
meal_breakfast.and.one.other.meal meal_breakfast.lunch.…¹ meal_no.meal.package
<dbl> <dbl> <dbl>
1 0 0 0
2 1 0 0
3 0 0 1
4 0 1 0
# ℹ abbreviated name: ¹meal_breakfast.lunch.and.dinnerstep_*()
Adds a single transformation to a recipe. Transformations are replayed in order when the recipe is run on data.
Before recipe
# A tibble: 4 × 1
  arrival_date
  <date>
1 2016-09-02
2 2016-09-09
3 2016-09-15
4 2016-09-16
After recipe
# A tibble: 4 × 19
  arrival_date arrival_date_year arrival_date_dow_Mon arrival_date_dow_Tue arrival_date_dow_Wed
  <date>                   <int>                <dbl>                <dbl>                <dbl>
1 2016-09-02                2016                    0                    0                    0
2 2016-09-09                2016                    0                    0                    0
3 2016-09-15                2016                    0                    0                    0
4 2016-09-16                2016                    0                    0                    0
# ℹ 14 more variables: arrival_date_dow_Thu <dbl>, arrival_date_dow_Fri <dbl>,
#   arrival_date_dow_Sat <dbl>, arrival_date_month_Feb <dbl>, arrival_date_month_Mar <dbl>,
#   arrival_date_month_Apr <dbl>, arrival_date_month_May <dbl>, arrival_date_month_Jun <dbl>,
#   arrival_date_month_Jul <dbl>, arrival_date_month_Aug <dbl>, arrival_date_month_Sep <dbl>,
#   arrival_date_month_Oct <dbl>, arrival_date_month_Nov <dbl>, arrival_date_month_Dec <dbl>
step_holiday() + step_rm()
Generate a set of indicator variables for specific holidays.
holidays <- c(
  "AllSouls",
  "AshWednesday",
  "ChristmasEve",
  "Easter",
  "ChristmasDay",
  "GoodFriday",
  "NewYearsDay",
  "PalmSunday"
)

hotel_rec <- recipe(avg_price_per_room ~ ., data = hotel_train) |>
  step_date(arrival_date) |>
  step_holiday(arrival_date, holidays = holidays) |>
  step_rm(arrival_date) |>
  step_dummy(all_nominal_predictors())
step_holiday() + step_rm()
Rows: 3,749
Columns: 26
$ arrival_date_year         <int> 2016, 2016, 2016, 2016, 2016, 2016, 2016, 2016, 2016, 2016, 2016…
$ arrival_date_AllSouls     <int> 0, 0, 0, 0, 0, 0, 0, 0, 0, 0, 0, 0, 0, 0, 0, 0, 0, 0, 0, 0, 0, 0…
$ arrival_date_AshWednesday <int> 0, 0, 0, 0, 0, 0, 0, 0, 0, 0, 0, 0, 0, 0, 0, 0, 0, 0, 0, 0, 0, 0…
$ arrival_date_ChristmasEve <int> 0, 0, 0, 0, 0, 0, 0, 0, 0, 0, 0, 0, 0, 0, 0, 0, 0, 0, 0, 0, 0, 0…
$ arrival_date_Easter       <int> 0, 0, 0, 0, 0, 0, 0, 0, 0, 0, 0, 0, 0, 0, 0, 0, 0, 0, 0, 0, 0, 0…
$ arrival_date_ChristmasDay <int> 0, 0, 0, 0, 0, 0, 0, 0, 0, 0, 0, 0, 0, 0, 0, 0, 0, 0, 0, 0, 0, 0…
$ arrival_date_GoodFriday   <int> 0, 0, 0, 0, 0, 0, 0, 0, 0, 0, 0, 0, 0, 0, 0, 0, 0, 0, 0, 0, 0, 0…
$ arrival_date_NewYearsDay  <int> 0, 0, 0, 0, 0, 0, 0, 0, 0, 0, 0, 0, 0, 0, 0, 0, 0, 0, 0, 0, 0, 0…
$ arrival_date_PalmSunday   <int> 0, 0, 0, 0, 0, 0, 0, 0, 0, 0, 0, 0, 0, 0, 0, 0, 0, 0, 0, 0, 0, 0…
$ arrival_date_dow_Mon      <dbl> 0, 0, 0, 0, 0, 0, 0, 0, 1, 1, 0, 0, 0, 0, 0, 0, 0, 1, 1, 1, 0, 0…
$ arrival_date_dow_Tue      <dbl> 0, 0, 0, 0, 0, 0, 0, 1, 0, 0, 0, 0, 0, 0, 0, 0, 0, 0, 0, 0, 0, 0…
$ arrival_date_dow_Wed      <dbl> 0, 0, 0, 0, 0, 0, 0, 0, 0, 0, 0, 0, 0, 0, 0, 0, 0, 0, 0, 0, 1, 1…
$ arrival_date_dow_Thu      <dbl> 0, 0, 1, 0, 0, 0, 0, 0, 0, 0, 1, 1, 1, 1, 0, 0, 0, 0, 0, 0, 0, 0…
$ arrival_date_dow_Fri      <dbl> 1, 1, 0, 1, 0, 0, 0, 0, 0, 0, 0, 0, 0, 0, 0, 0, 0, 0, 0, 0, 0, 0…
$ arrival_date_dow_Sat      <dbl> 0, 0, 0, 0, 0, 0, 0, 0, 0, 0, 0, 0, 0, 0, 1, 0, 0, 0, 0, 0, 0, 0…
$ arrival_date_month_Feb    <dbl> 0, 0, 0, 0, 0, 0, 0, 0, 0, 0, 0, 0, 0, 0, 0, 0, 0, 0, 0, 0, 0, 0…
$ arrival_date_month_Mar    <dbl> 0, 0, 0, 0, 0, 0, 0, 0, 0, 0, 0, 0, 0, 0, 0, 0, 0, 0, 0, 0, 0, 0…
$ arrival_date_month_Apr    <dbl> 0, 0, 0, 0, 0, 0, 0, 0, 0, 0, 0, 0, 0, 0, 0, 0, 0, 0, 0, 0, 0, 0…
$ arrival_date_month_May    <dbl> 0, 0, 0, 0, 0, 0, 0, 0, 0, 0, 0, 0, 0, 0, 0, 0, 0, 0, 0, 0, 0, 0…
$ arrival_date_month_Jun    <dbl> 0, 0, 0, 0, 0, 0, 0, 0, 0, 0, 0, 0, 0, 0, 0, 0, 0, 0, 0, 0, 0, 0…
$ arrival_date_month_Jul    <dbl> 0, 0, 0, 0, 0, 0, 0, 0, 0, 0, 0, 0, 0, 0, 0, 0, 0, 0, 0, 0, 0, 0…
$ arrival_date_month_Aug    <dbl> 0, 0, 0, 0, 0, 0, 0, 0, 0, 0, 0, 0, 0, 0, 0, 0, 0, 0, 0, 0, 0, 0…
$ arrival_date_month_Sep    <dbl> 1, 1, 1, 1, 1, 1, 1, 1, 1, 1, 1, 1, 1, 1, 0, 0, 0, 0, 0, 0, 0, 0…
$ arrival_date_month_Oct    <dbl> 0, 0, 0, 0, 0, 0, 0, 0, 0, 0, 0, 0, 0, 0, 1, 1, 1, 1, 1, 1, 1, 1…
$ arrival_date_month_Nov    <dbl> 0, 0, 0, 0, 0, 0, 0, 0, 0, 0, 0, 0, 0, 0, 0, 0, 0, 0, 0, 0, 0, 0…
$ arrival_date_month_Dec    <dbl> 0, 0, 0, 0, 0, 0, 0, 0, 0, 0, 0, 0, 0, 0, 0, 0, 0, 0, 0, 0, 0, 0…
Additional feature engineering steps
Filter out constant columns
- Remove any predictors that have zero variance
- Artifact of
step_dummy()(factor levels that were never observed in training) - Original predictors that are constant
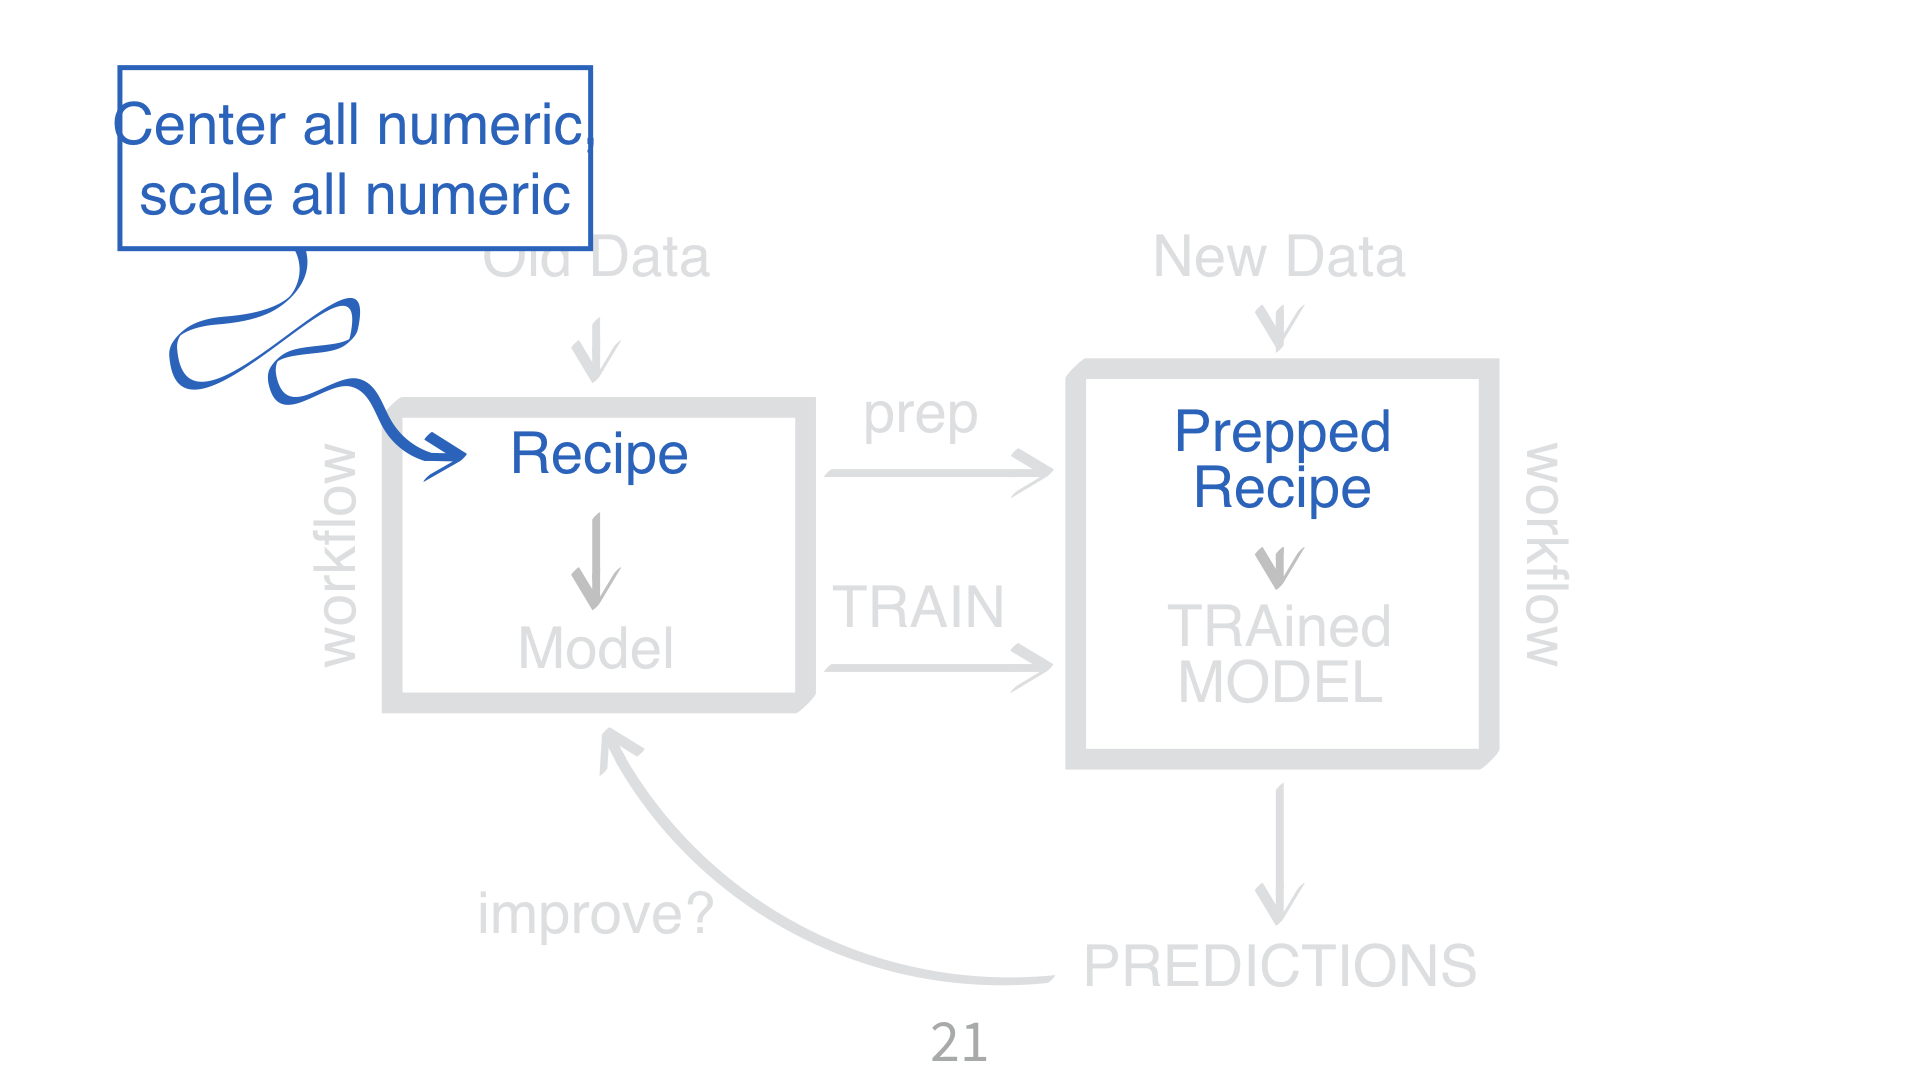
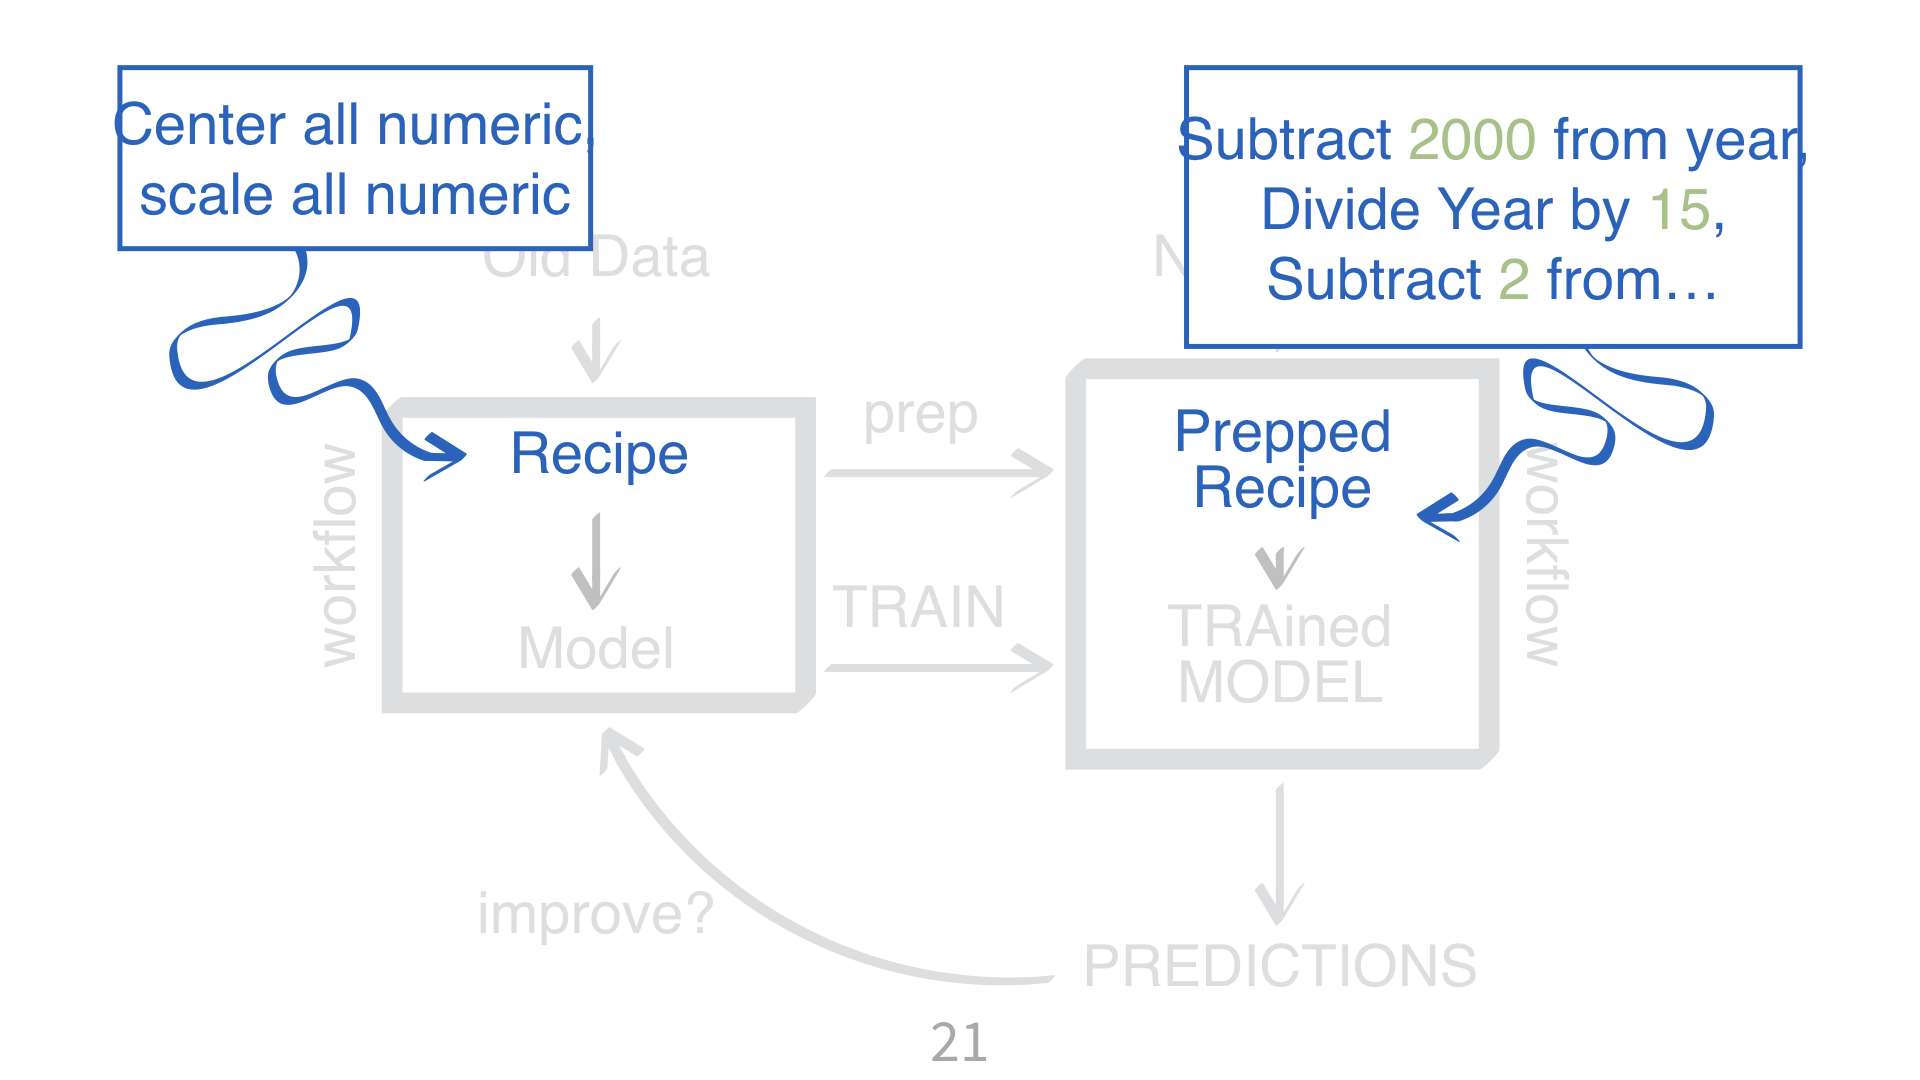
Normalization
This centers and scales the numeric predictors
The recipe will use the training set to estimate the means and standard deviations of the data
All data the recipe is applied to will be normalized using those statistics (there is no re-estimation)
Reduce correlation
hotel_rec <- recipe(avg_price_per_room ~ ., data = hotel_train) |>
  step_date(arrival_date) |>
  step_holiday(arrival_date, holidays = holidays) |>
  step_rm(arrival_date) |>
  step_dummy(all_nominal_predictors()) |>
step_zv(all_predictors()) |>
step_normalize(all_numeric_predictors()) |>
step_corr(all_numeric_predictors(), threshold = 0.9)To deal with highly correlated predictors, find the minimum set of predictor columns that make the pairwise correlations less than the threshold.
Other possible steps
hotel_rec <- recipe(avg_price_per_room ~ ., data = hotel_train) |>
  step_date(arrival_date) |>
  step_holiday(arrival_date, holidays = holidays) |>
  step_rm(arrival_date) |>
  step_dummy(all_nominal_predictors()) |>
  step_zv(all_predictors()) |>
step_normalize(all_numeric_predictors()) |>
step_corr(all_numeric_predictors(), threshold = 0.9) |>
step_pca(all_numeric_predictors())PCA feature extraction…
Other possible steps
hotel_rec <- recipe(avg_price_per_room ~ ., data = hotel_train) |>
  step_date(arrival_date) |>
  step_holiday(arrival_date, holidays = holidays) |>
  step_rm(arrival_date) |>
  step_dummy(all_nominal_predictors()) |>
  step_zv(all_predictors()) |>
  step_normalize(all_numeric_predictors()) |>
step_corr(all_numeric_predictors(), threshold = 0.9) |>
embed::step_umap(all_numeric_predictors(), outcome = vars(avg_price_per_room))A fancy machine learning supervised dimension reduction technique called UMAP…
Other possible steps
hotel_rec <- recipe(avg_price_per_room ~ ., data = hotel_train) |>
  step_date(arrival_date) |>
  step_holiday(arrival_date, holidays = holidays) |>
  step_rm(arrival_date) |>
  step_dummy(all_nominal_predictors()) |>
  step_zv(all_predictors()) |>
  step_normalize(all_numeric_predictors()) |>
  step_corr(all_numeric_predictors(), threshold = 0.9) |>
  step_spline_natural(lead_time, deg_free = 10)
Nonlinear transforms like natural splines, and so on!
Now we’ve built a recipe.
But, how do we use a recipe?
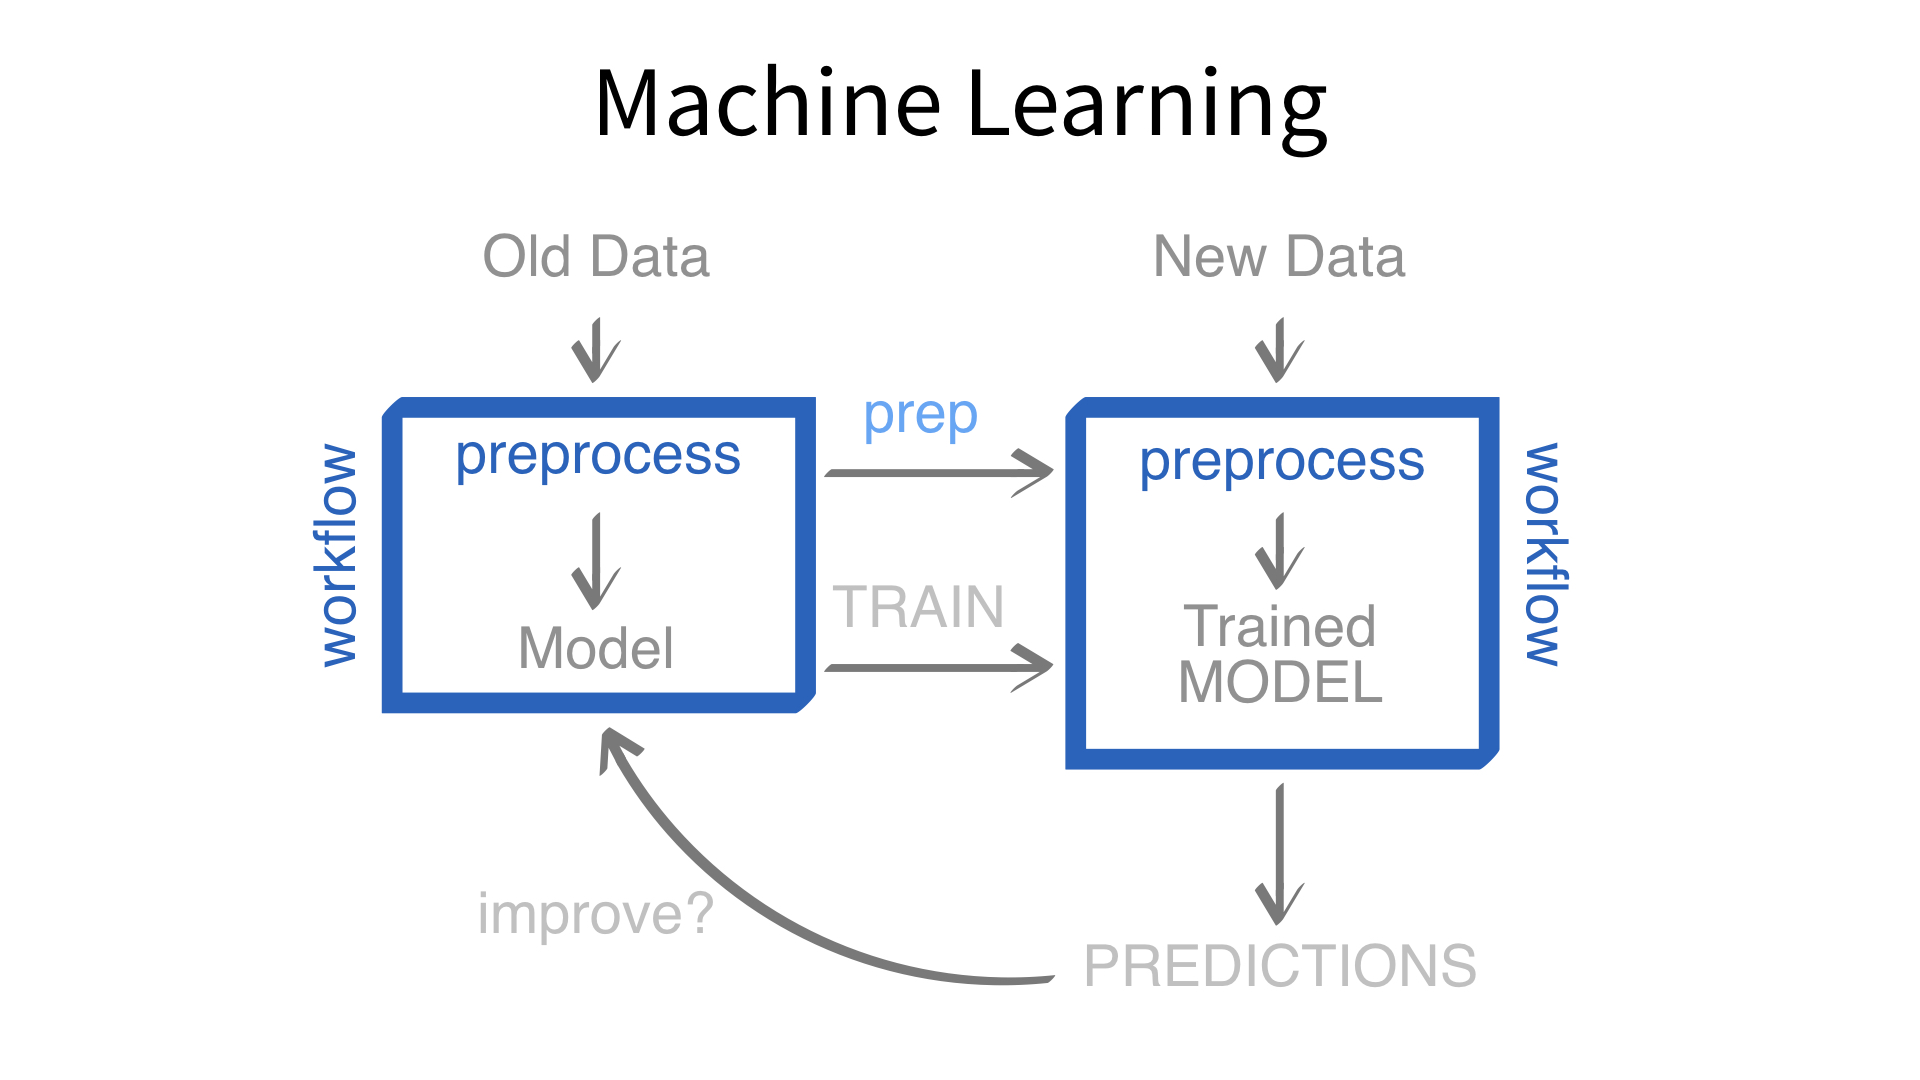
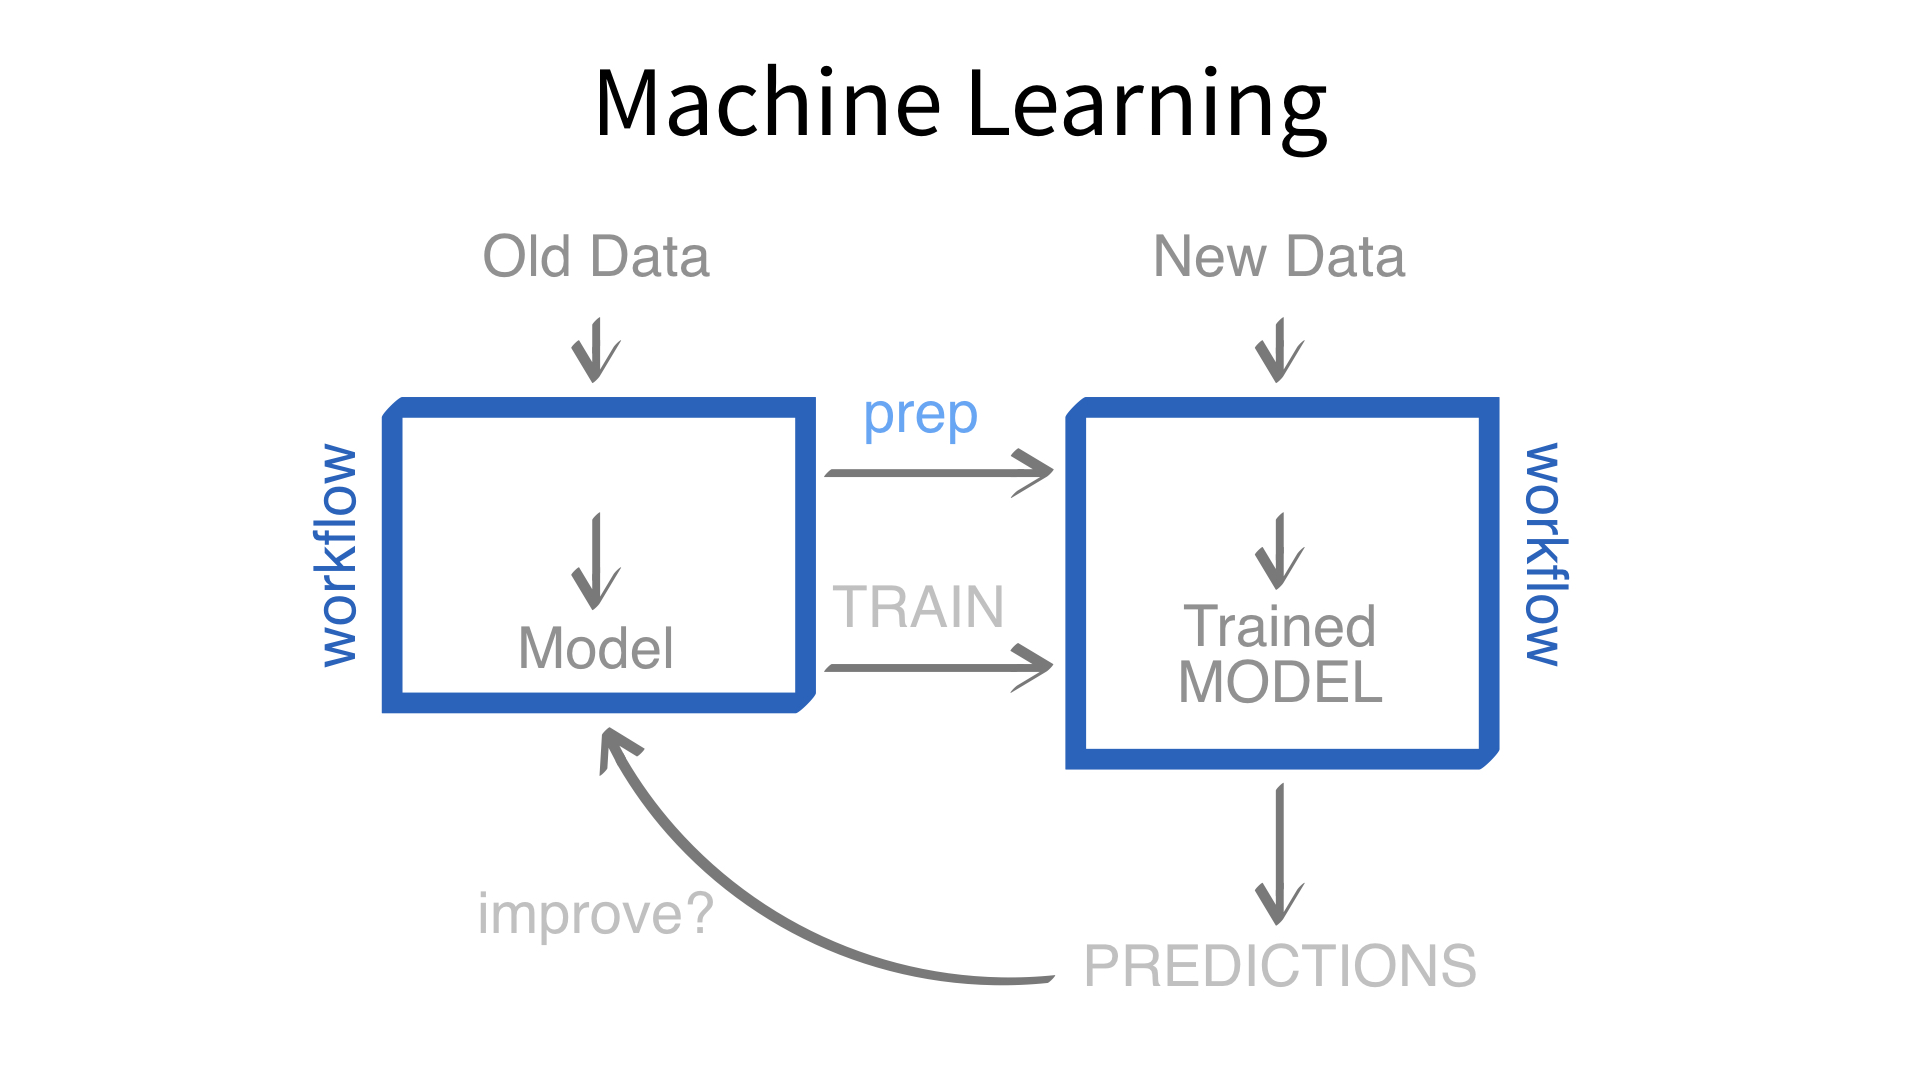
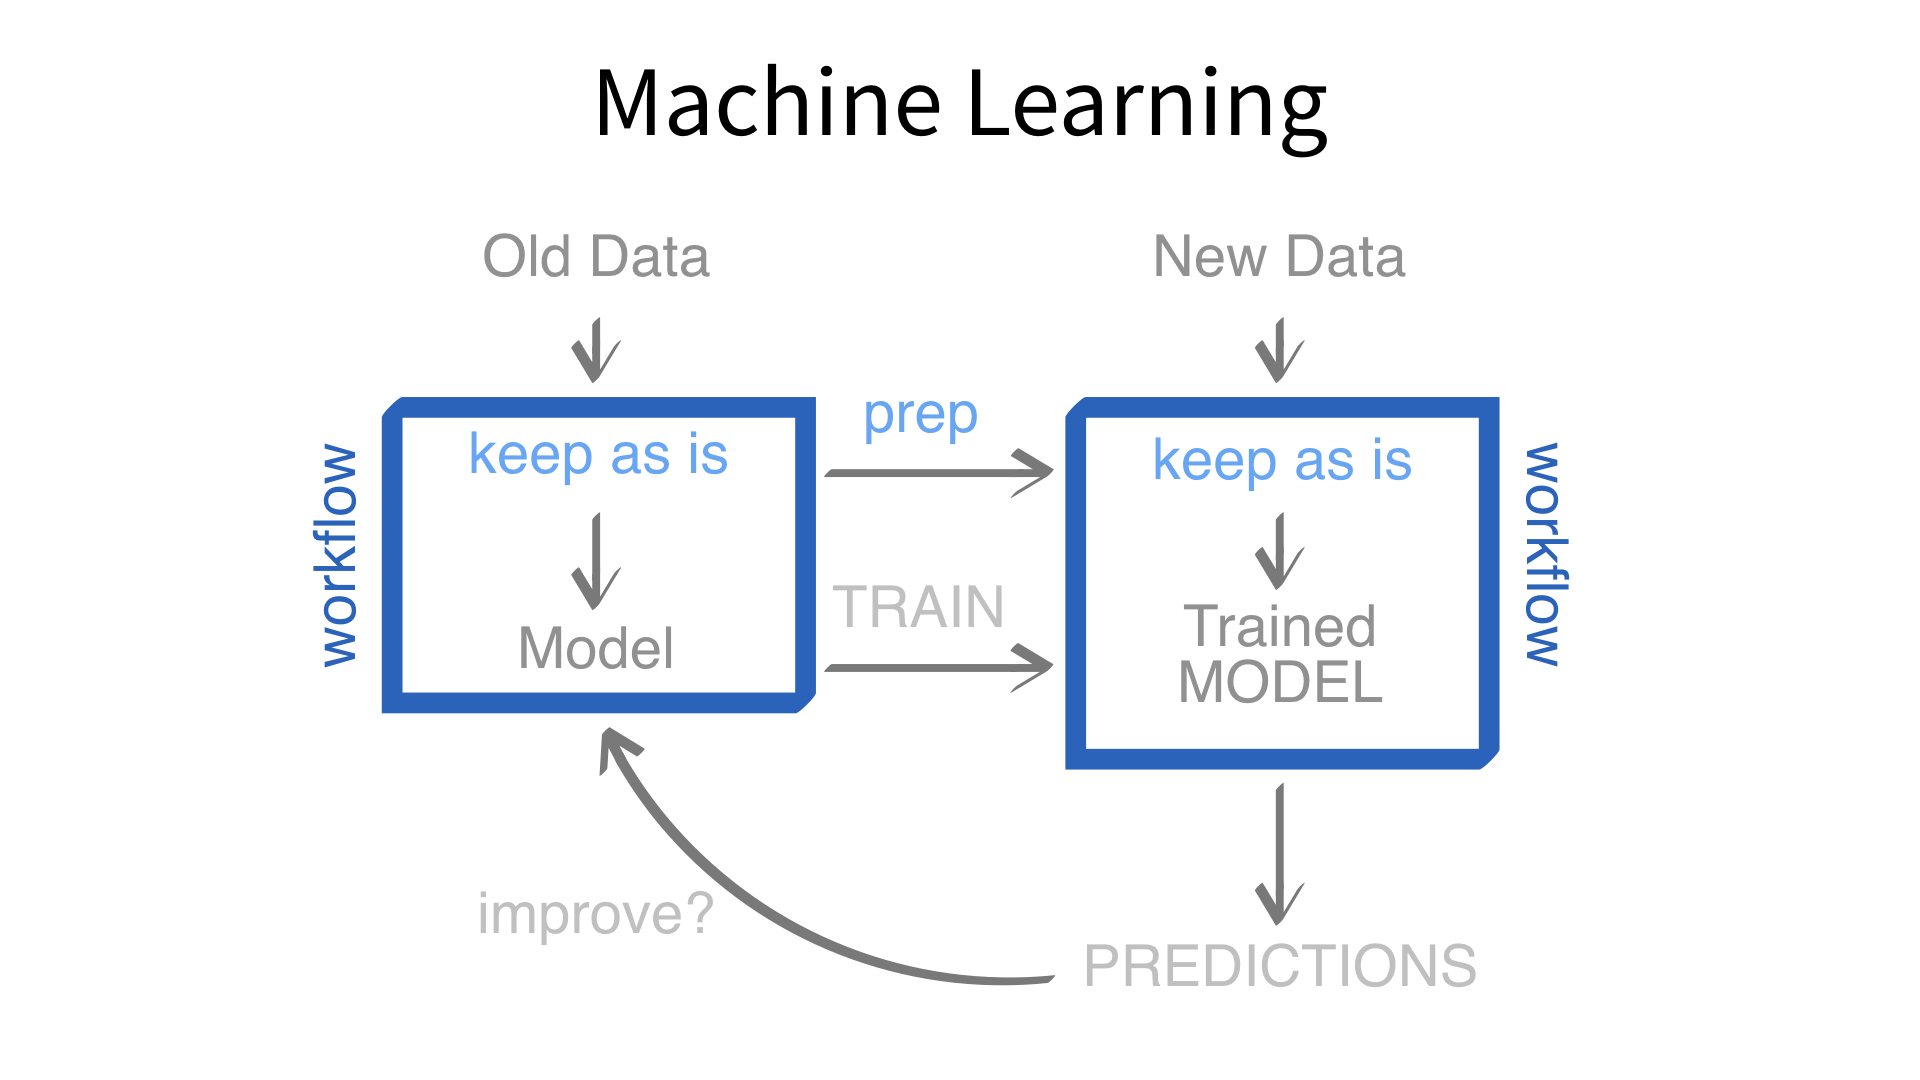
Axiom
Feature engineering and modeling are two halves of a single predictive workflow.

Minimal recipe
workflow()
Creates a workflow to which you can add a model (and more)
Use Pipeline to combine preprocessing and modeling steps.
add_formula()
Adds a formula to a workflow *
add_recipe()
Adds a recipe() to a workflow
add_model()
Adds a {parsnip} model specification to a workflow
Measuring performance
We’ll compute three measures: root mean squared error, mean absolute error, and the coefficient of determination (a.k.a \(R^2\)).
\[ \begin{align} RMSE &= \sqrt{\frac{1}{n}\sum_{i=1}^n (y_i - \hat{y}_i)^2} \notag \\ MAE &= \frac{1}{n}\sum_{i=1}^n |y_i - \hat{y}_i| \notag \\ R^2 &= cor(y_i, \hat{y}_i)^2 \end{align} \]
Establish a baseline
# A tibble: 3 × 6
  .metric .estimator  mean     n std_err .config
  <chr>   <chr>      <dbl> <int>   <dbl> <chr>
1 mae     standard    53.1    10   0.460 Preprocessor1_Model1
2 rmse    standard    65.9    10   0.758 Preprocessor1_Model1
3 rsq     standard   NaN       0  NA     Preprocessor1_Model1
Using a workflow
# A tibble: 3 × 6
.metric .estimator mean n std_err .config
<chr> <chr> <dbl> <int> <dbl> <chr>
1 mae standard 17.5 10 0.283 Preprocessor1_Model1
2 rmse standard 24.1 10 0.540 Preprocessor1_Model1
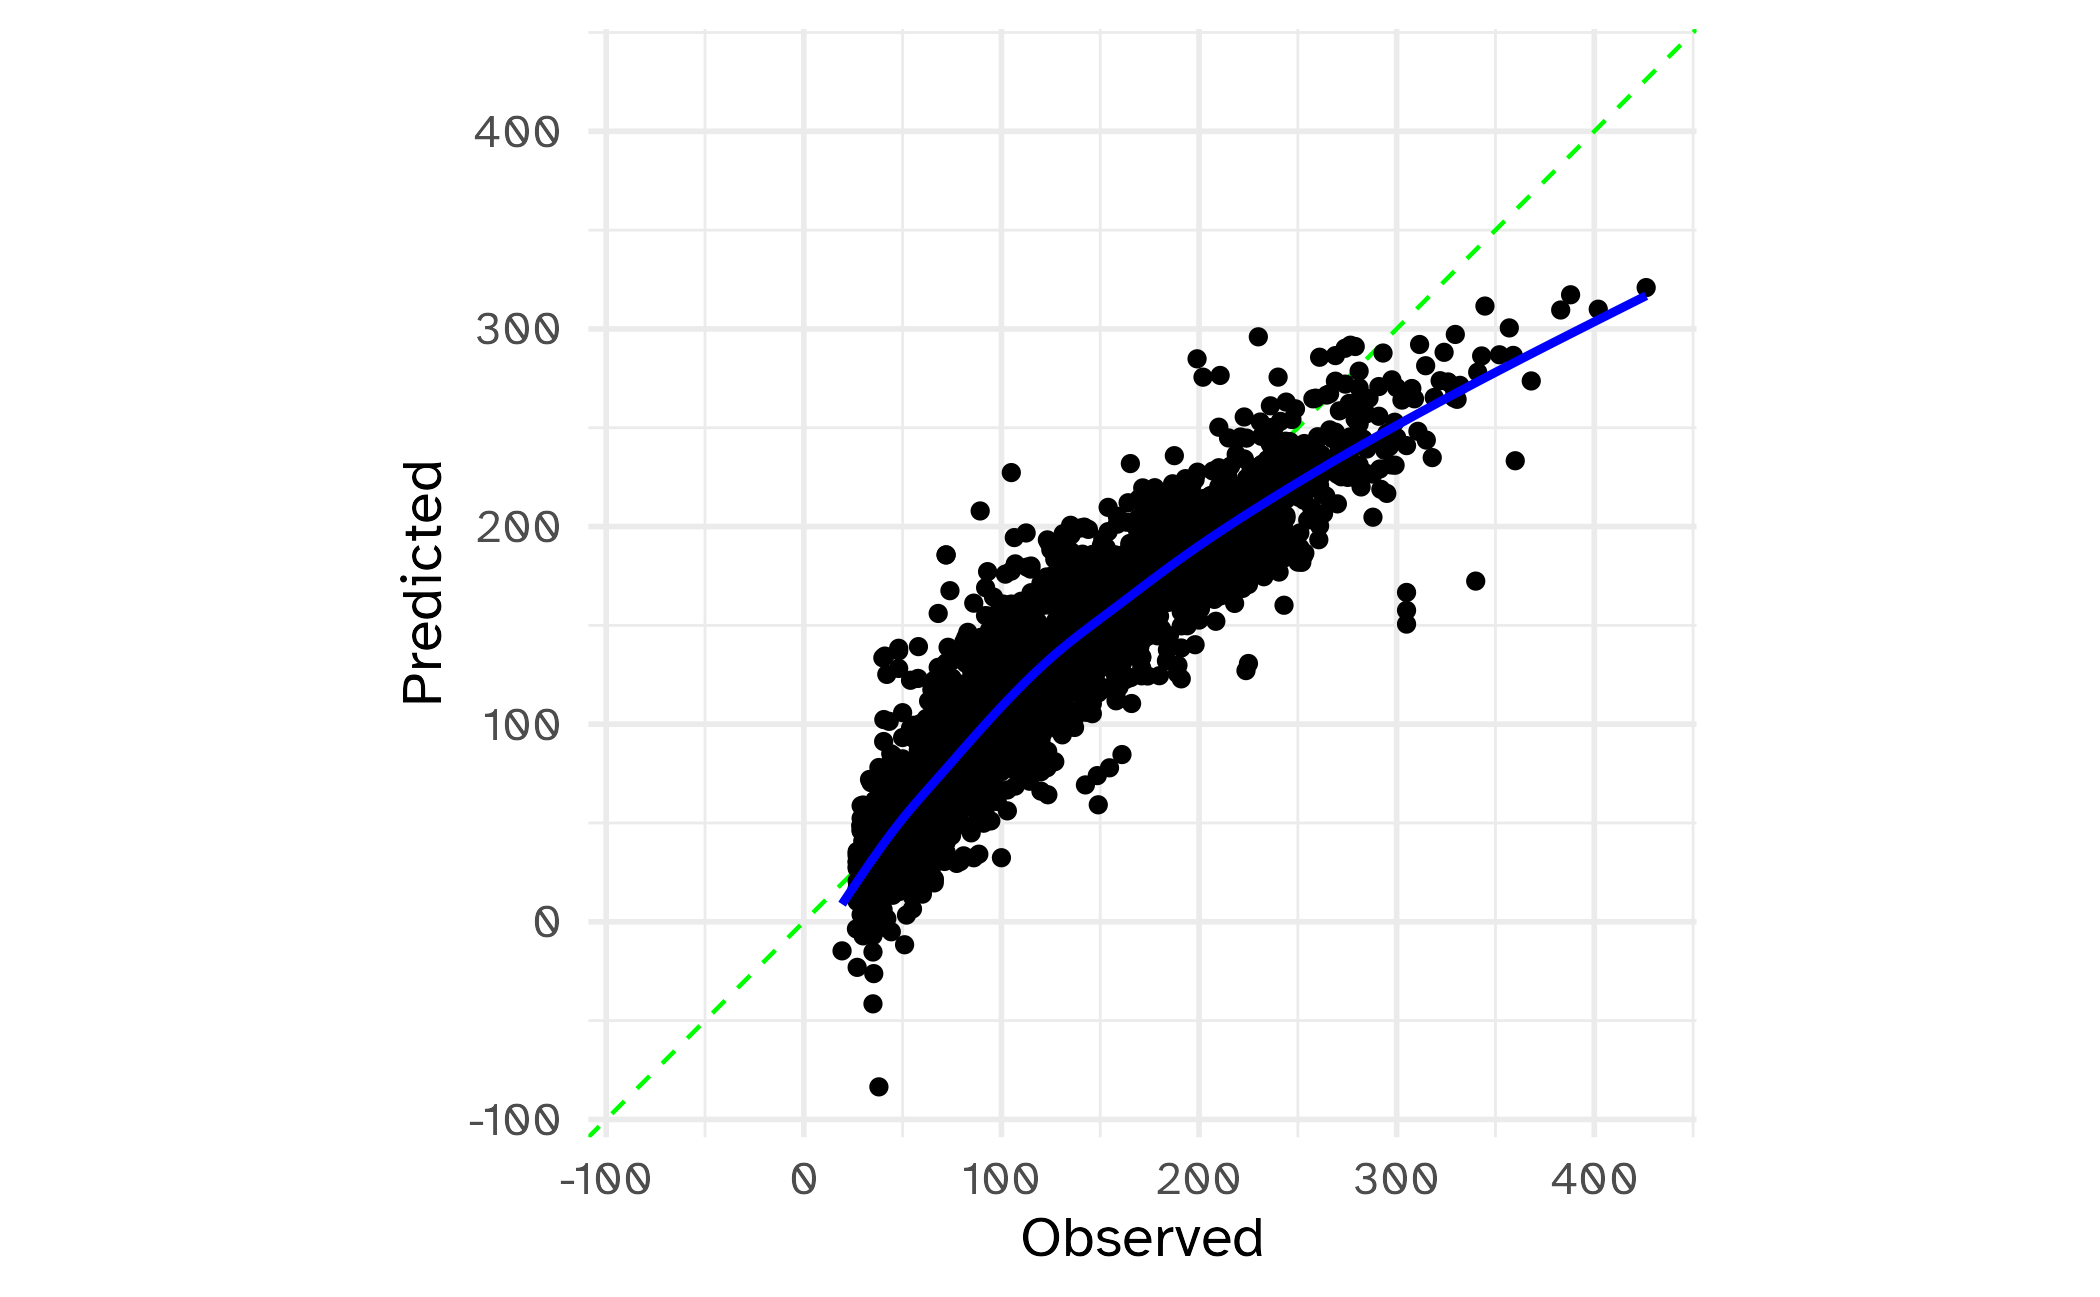
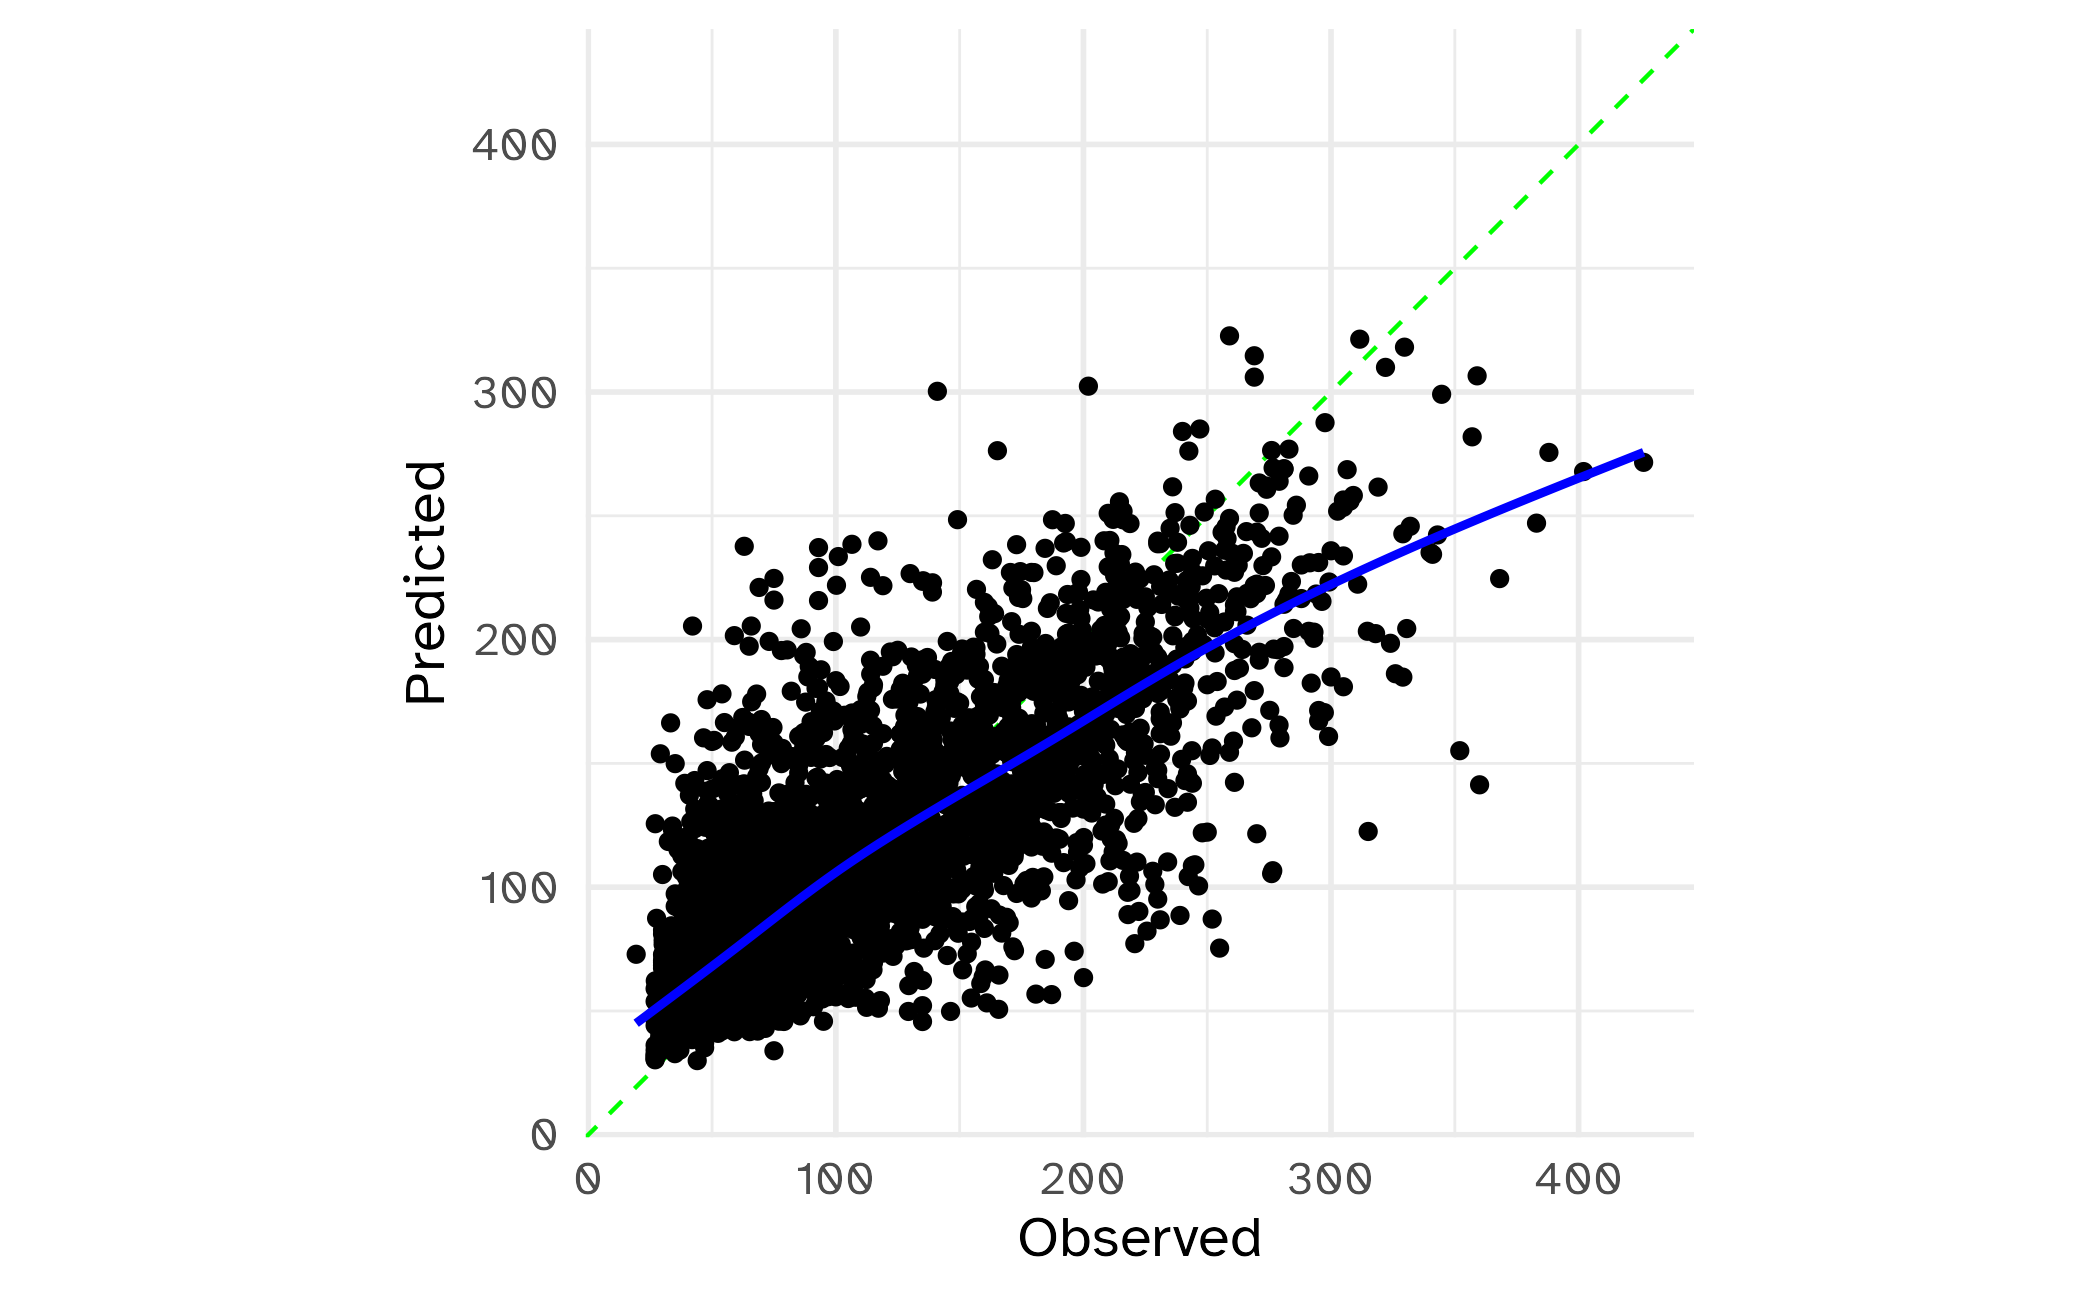
3 rsq standard 0.867 10 0.00461 Preprocessor1_Model1Calibration Plot
Train a nearest neighbor model
K Nearest Neighbors (KNN)
To predict the outcome of a new data point:
- Find the K most similar old data points
- Take the average/mode/etc. outcome
Fact
KNN requires all numeric predictors, and all need to be centered and scaled.
What does that mean?
Quiz
Why do you need to “train” a recipe?
Imagine “scaling” a new data point. What do you subtract from it? What do you divide it by?
📝 Properly sequence your steps
Instructions
Arrange these data preprocessing/feature engineering steps in the correct order for a KNN model:
- Center and scale numeric predictors
- Remove highly correlated predictors
- Convert
arrival_dateto indicators for day of week, month, year - Remove
arrival_date - Indicators for holidays
- Remove zero-variance predictors
- Convert categorical predictors to binary indicators
05:00
Define the recipe
knn_rec <- recipe(avg_price_per_room ~ ., data = hotel_train) |>
  step_date(arrival_date) |>
  step_holiday(arrival_date, holidays = holidays) |>
  step_rm(arrival_date) |>
  step_dummy(all_nominal_predictors()) |>
  step_zv(all_predictors()) |>
  step_normalize(all_numeric_predictors()) |>
  step_corr(all_numeric_predictors(), threshold = 0.9)
Fit the model
knn_mod <- nearest_neighbor(neighbors = 10) |>
  set_engine("kknn") |>
  set_mode("regression")

set.seed(12)

hotel_knn_wflow <- workflow() |>
  add_recipe(knn_rec) |>
  add_model(knn_mod)

hotel_knn_res <- hotel_knn_wflow |>
  fit_resamples(hotel_rs, control = ctrl, metrics = reg_metrics)

collect_metrics(hotel_knn_res)
# A tibble: 3 × 6
.metric .estimator mean n std_err .config
<chr> <chr> <dbl> <int> <dbl> <chr>
1 mae standard 27.6 10 0.529 Preprocessor1_Model1
2 rmse standard 39.6 10 0.752 Preprocessor1_Model1
3 rsq standard 0.641 10 0.0107 Preprocessor1_Model1Calibration Plot
Wrap-up
Recap
- Predictors often need modification prior to modeling, either for data preprocessing or feature engineering
- Data preprocessing steps ensure that the data meets the model’s requirements
- Feature engineering steps may improve model performance, but will only find out after fitting the model
- Use {recipes} or
Pipelineto create reusable sequences of data transformations
Acknowledgments
- Materials derived in part from Machine learning with {tidymodels} and licensed under a Creative Commons Attribution-ShareAlike 4.0 International (CC BY-SA) License.