Exploratory data analysis
Lecture 10
Dr. Benjamin Soltoff
Cornell University
INFO 4940/5940 - Fall 2025
September 25, 2025
Announcements
Announcements
- No homework this week
- Project 01 begins next week
Learning objectives
- Review the importance of exploring and cleaning data prior to model development
- Implement visualization methods for exploring categorical and numeric predictors/outcomes
- Utilize techniques to identify outliers and missingness patterns in data
- Document exploratory steps using reproducible documents and Quarto
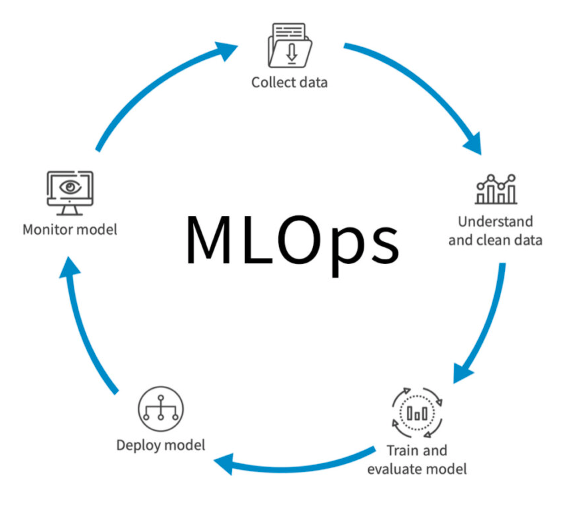
Illustration credit: Posit
Exploratory data analysis
Exploratory data analysis
- Generate questions about your data
- Search for answers by visualizing, transforming, and modeling your data
- Use what you learn to refine your questions and or generate new questions
Need to better understand the data before you can model it.
Things to investigate
- Variation
- Numeric
- Categorical
- Covariation
- Relationships between variables
- Patterns across groups
- Data quality
- Missing values
- Outliers
- Errors
Features of exploratory data analysis
Features of confirmatory data analysis
Reproducibility and documentation
It’s important to keep a log of all your EDA and data cleaning steps.
Allows you/colleagues to check your work, reproduce your results, and understand your process, especially when data cleaning actions can impact model performance.
Use literate programming and Quarto notebooks to record your exploration and analysis.
The Great American Coffee Taste Test
Coffee consumption in the United States
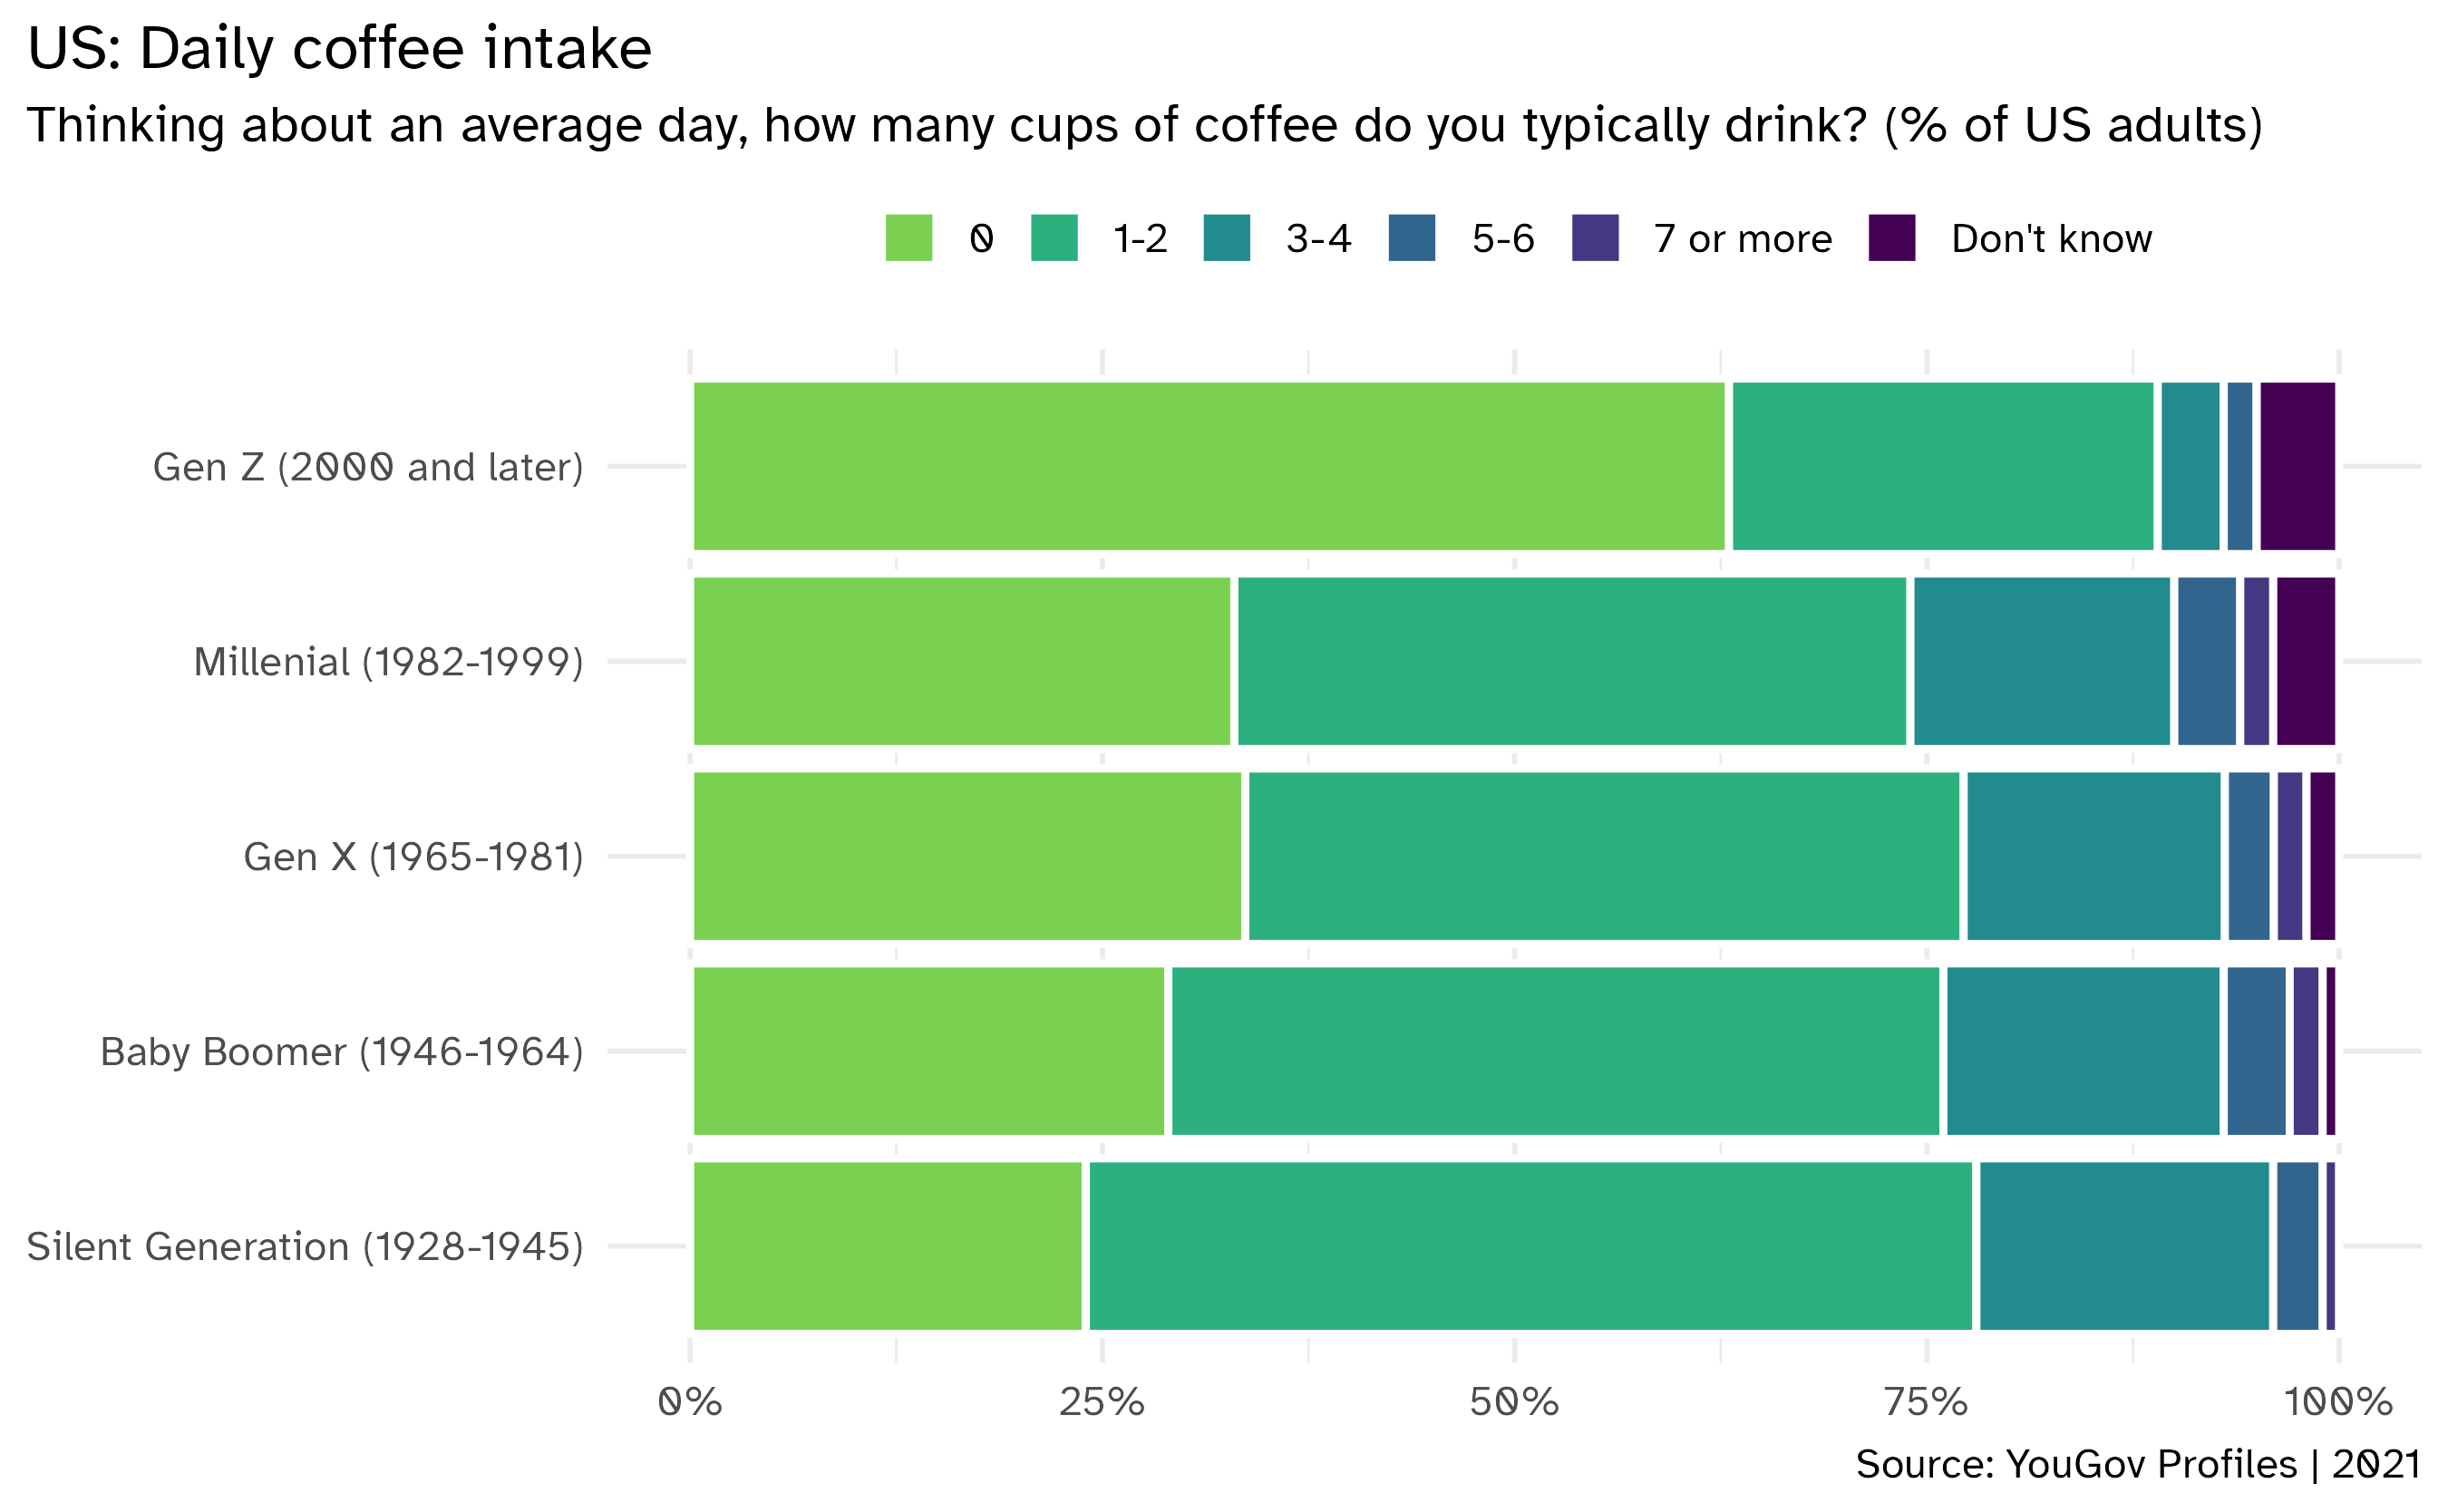
The Great American Coffee Taste Test
- Survey of 4,042 coffee drinkers conducted in October 2023
- Each respondent provided with four samples of coffee (single-blind study)
- Respondents brewed and evaluated each sample
- Survey includes measures about the four samples as well as general coffee preferences and demographic characteristics
ae-09
Instructions
- Go to the course GitHub org and find your
ae-09(repo name will be suffixed with your GitHub name). - Clone the repo in Positron, run
renv::restore()to install the required packages, open the Quarto document in the repo, and follow along and complete the exercises. - Render, commit, and push your edits by the AE deadline – end of the day
Examining continuous variables
Things to look for
- Asymmetry
- Outliers
- Multimodality
- Gaps
- Heaping
- Rounding
- Impossibilities
- Errors
Tons more info: Graphical Data Analysis with R
Common chart types
- Histogram:
geom_histogram()- Frequency polygon:
geom_freqpoly() - Density plot:
geom_density()
- Frequency polygon:
- Boxplot:
geom_boxplot() - Rug plot:
geom_rug() - Box plot:
geom_boxplot()(for subgroup distributions)- Violin plot:
geom_violin() - Beeswarm plot:
ggbeeswarm::geom_beeswarm()
- Violin plot:
📝 Examine the numeric variables
Instructions
Examine the numeric variables in the data set. Document your analysis in the Quarto notebook.
08:00
Examining categorical variables
Things to look for
- Unexpected patterns of results
- Uneven distributions
- Extra categories
- Large numbers of categories
- Don’t knows, refusals, errors,
NAs, …
Tons more info: Graphical Data Analysis with R
Common chart types
- Bar chart:
geom_bar() - Pie chart: Don’t
📝 Examine the categorical variables
Instructions
Examine the categorical variables in the data set. Document your analysis in the Quarto notebook.
08:00
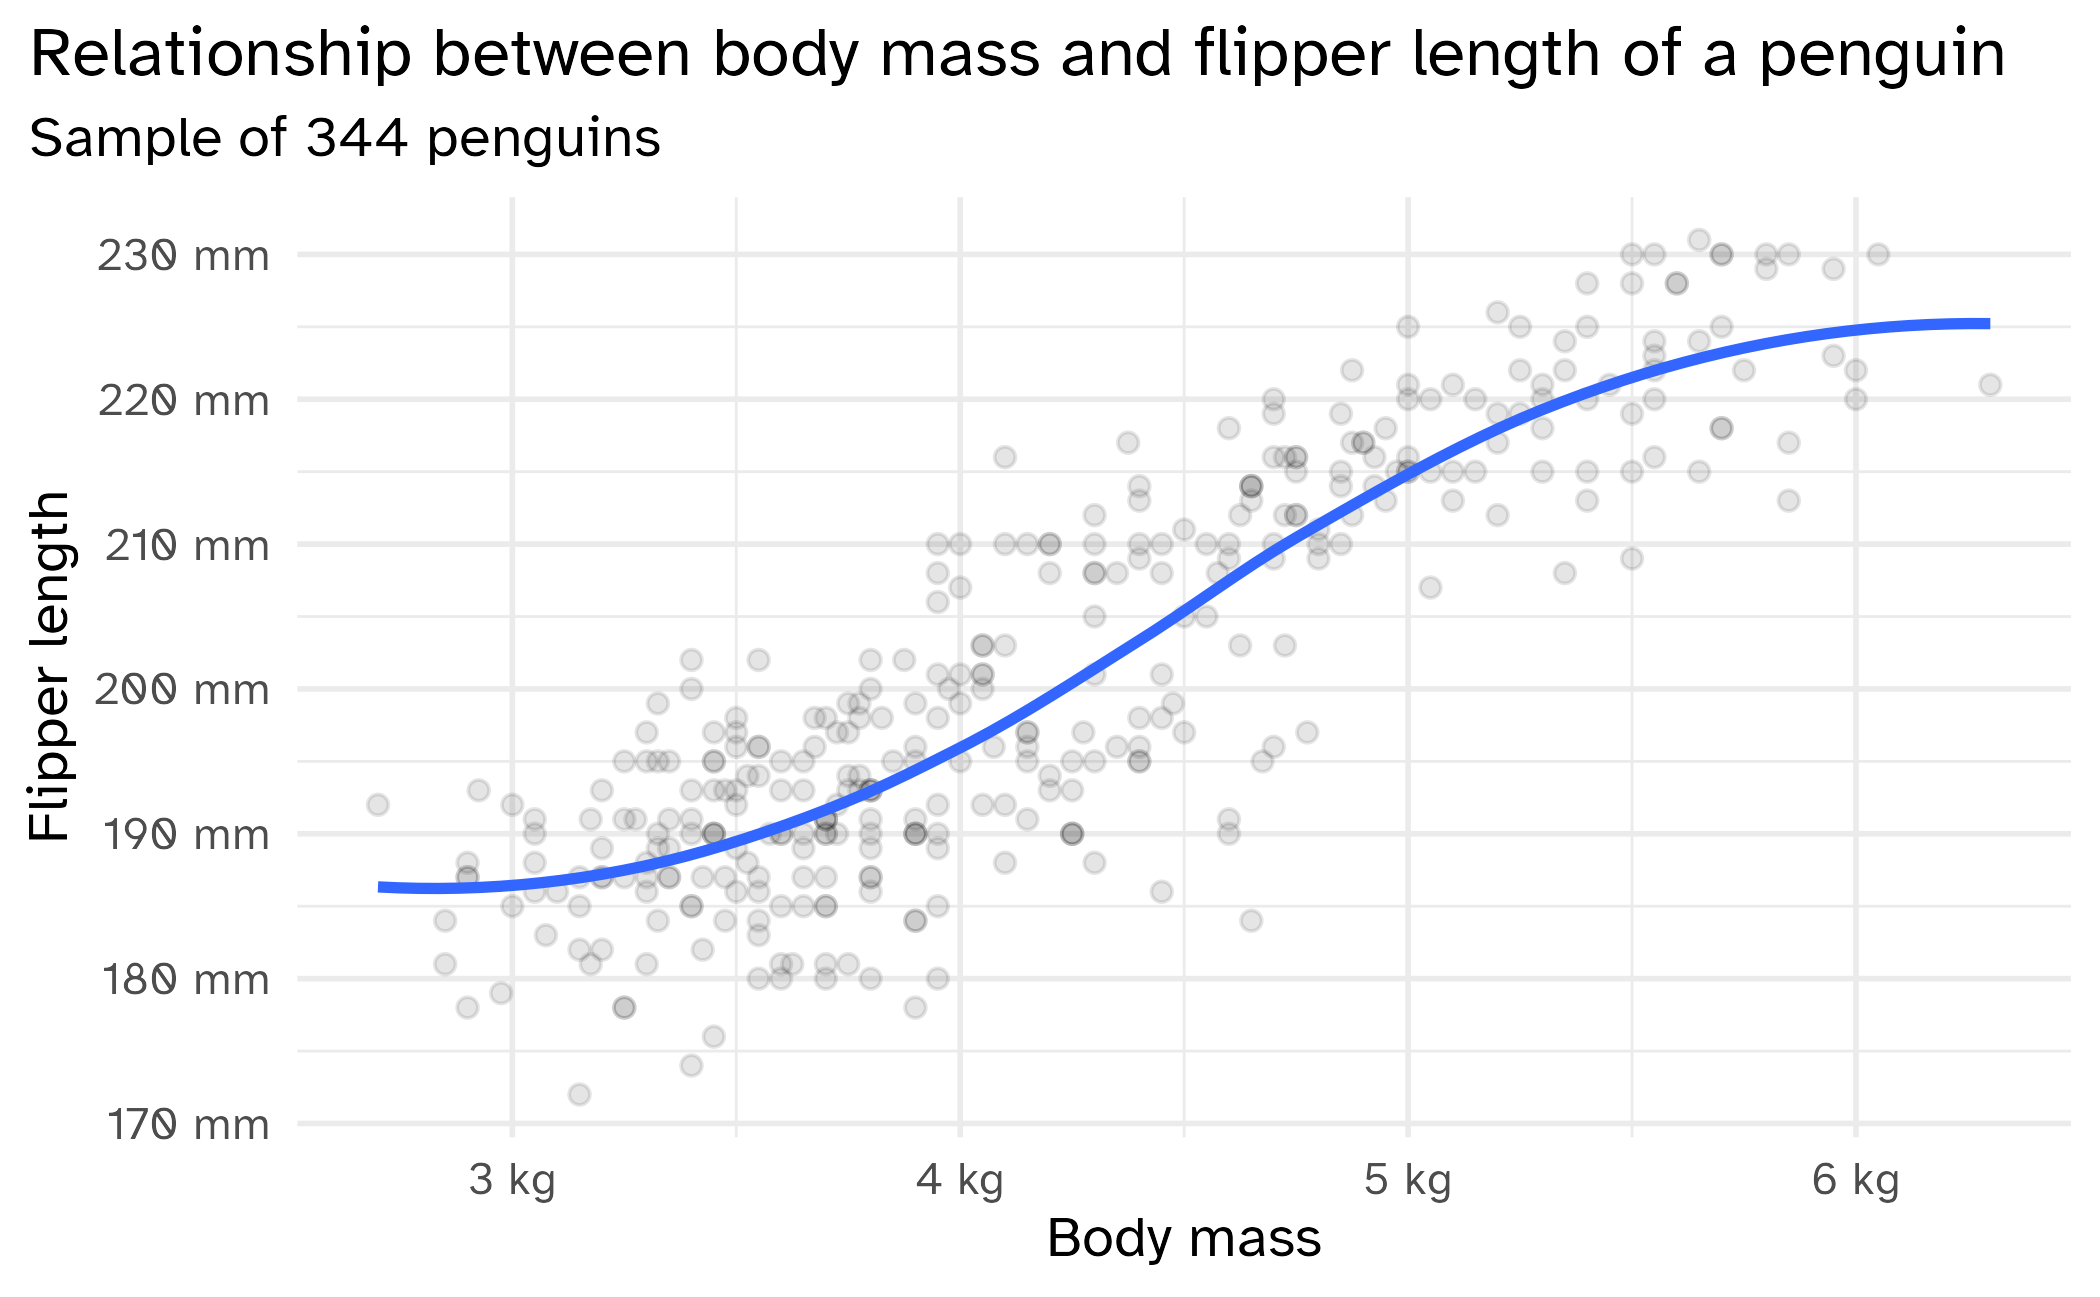
Making comparisons
Things to look for
- Causal relationships
- Associations/correlations
- Outliers (multidimensional)
- Clusters
- Gaps
- Barriers
- Conditional relationships
Tons more info: Graphical Data Analysis with R
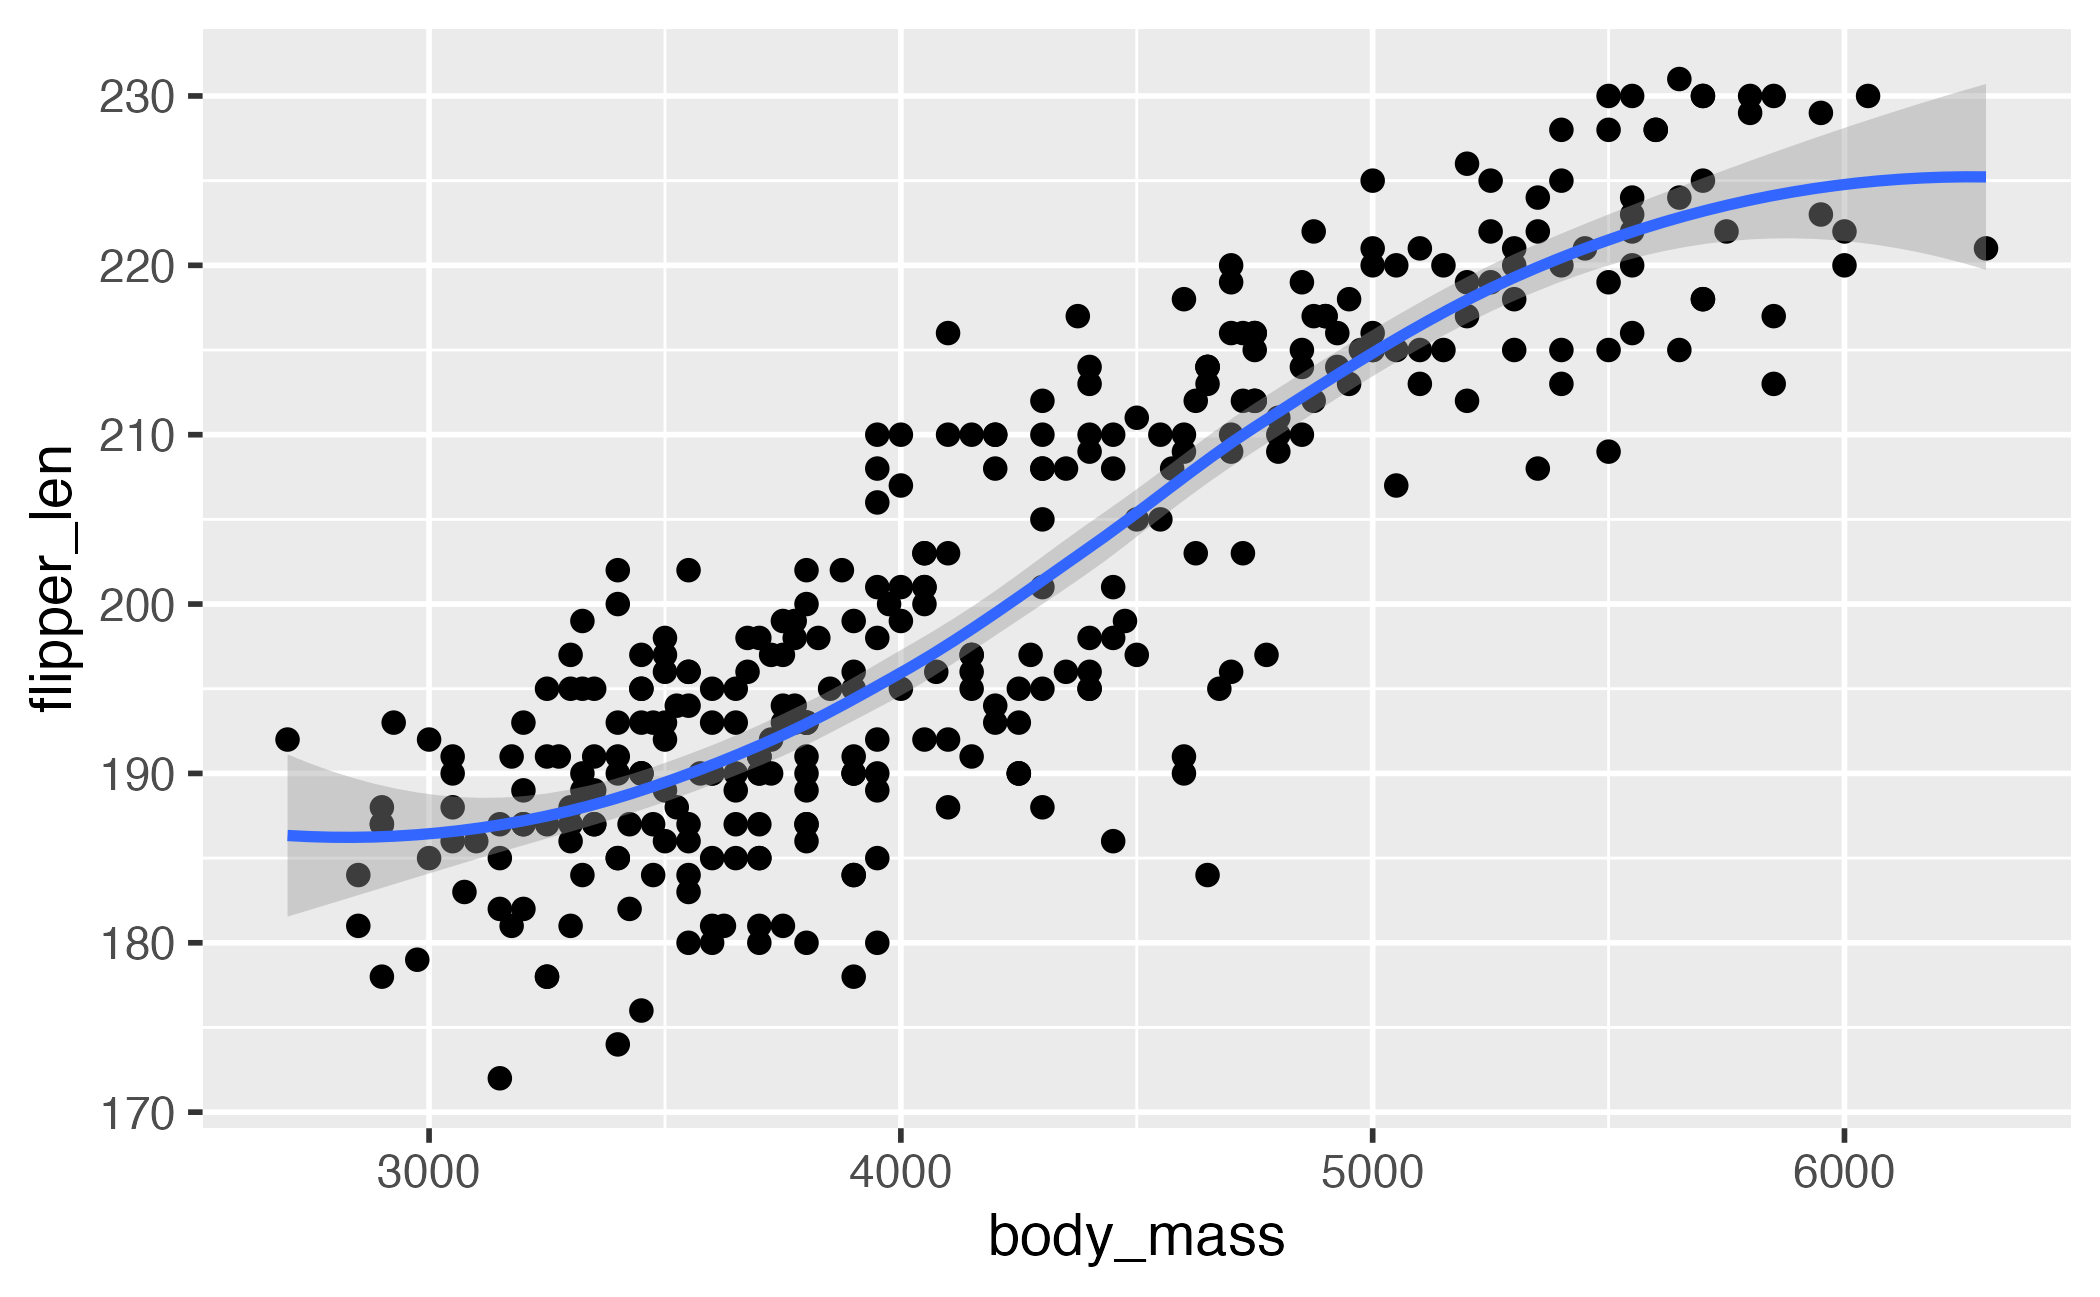
Common chart types
Scatterplot:
geom_point()Smoothing line:
geom_smooth()High density regions:
geom_density_2d()orgeom_hex()Comparing groups
- Color
- Faceting
Scatterplot matrix:
GGally::ggpairs()Categorical variables
geom_count()geom_bin2d()
📝 Relationship with outcome
Instructions
Examine the relationship between some of the variables and coffee_d_personal_preference. Document your analysis in the Quarto notebook.
08:00
Data quality
Missing values
Why values are missing
- Feature not measured
- Error replaced with
NA - “Don’t know” or “refused” to answer
- Trolling responses
What to do with missing values
- Remove the rows
- Remove the feature
- Impute plausible values
- Do nothing1
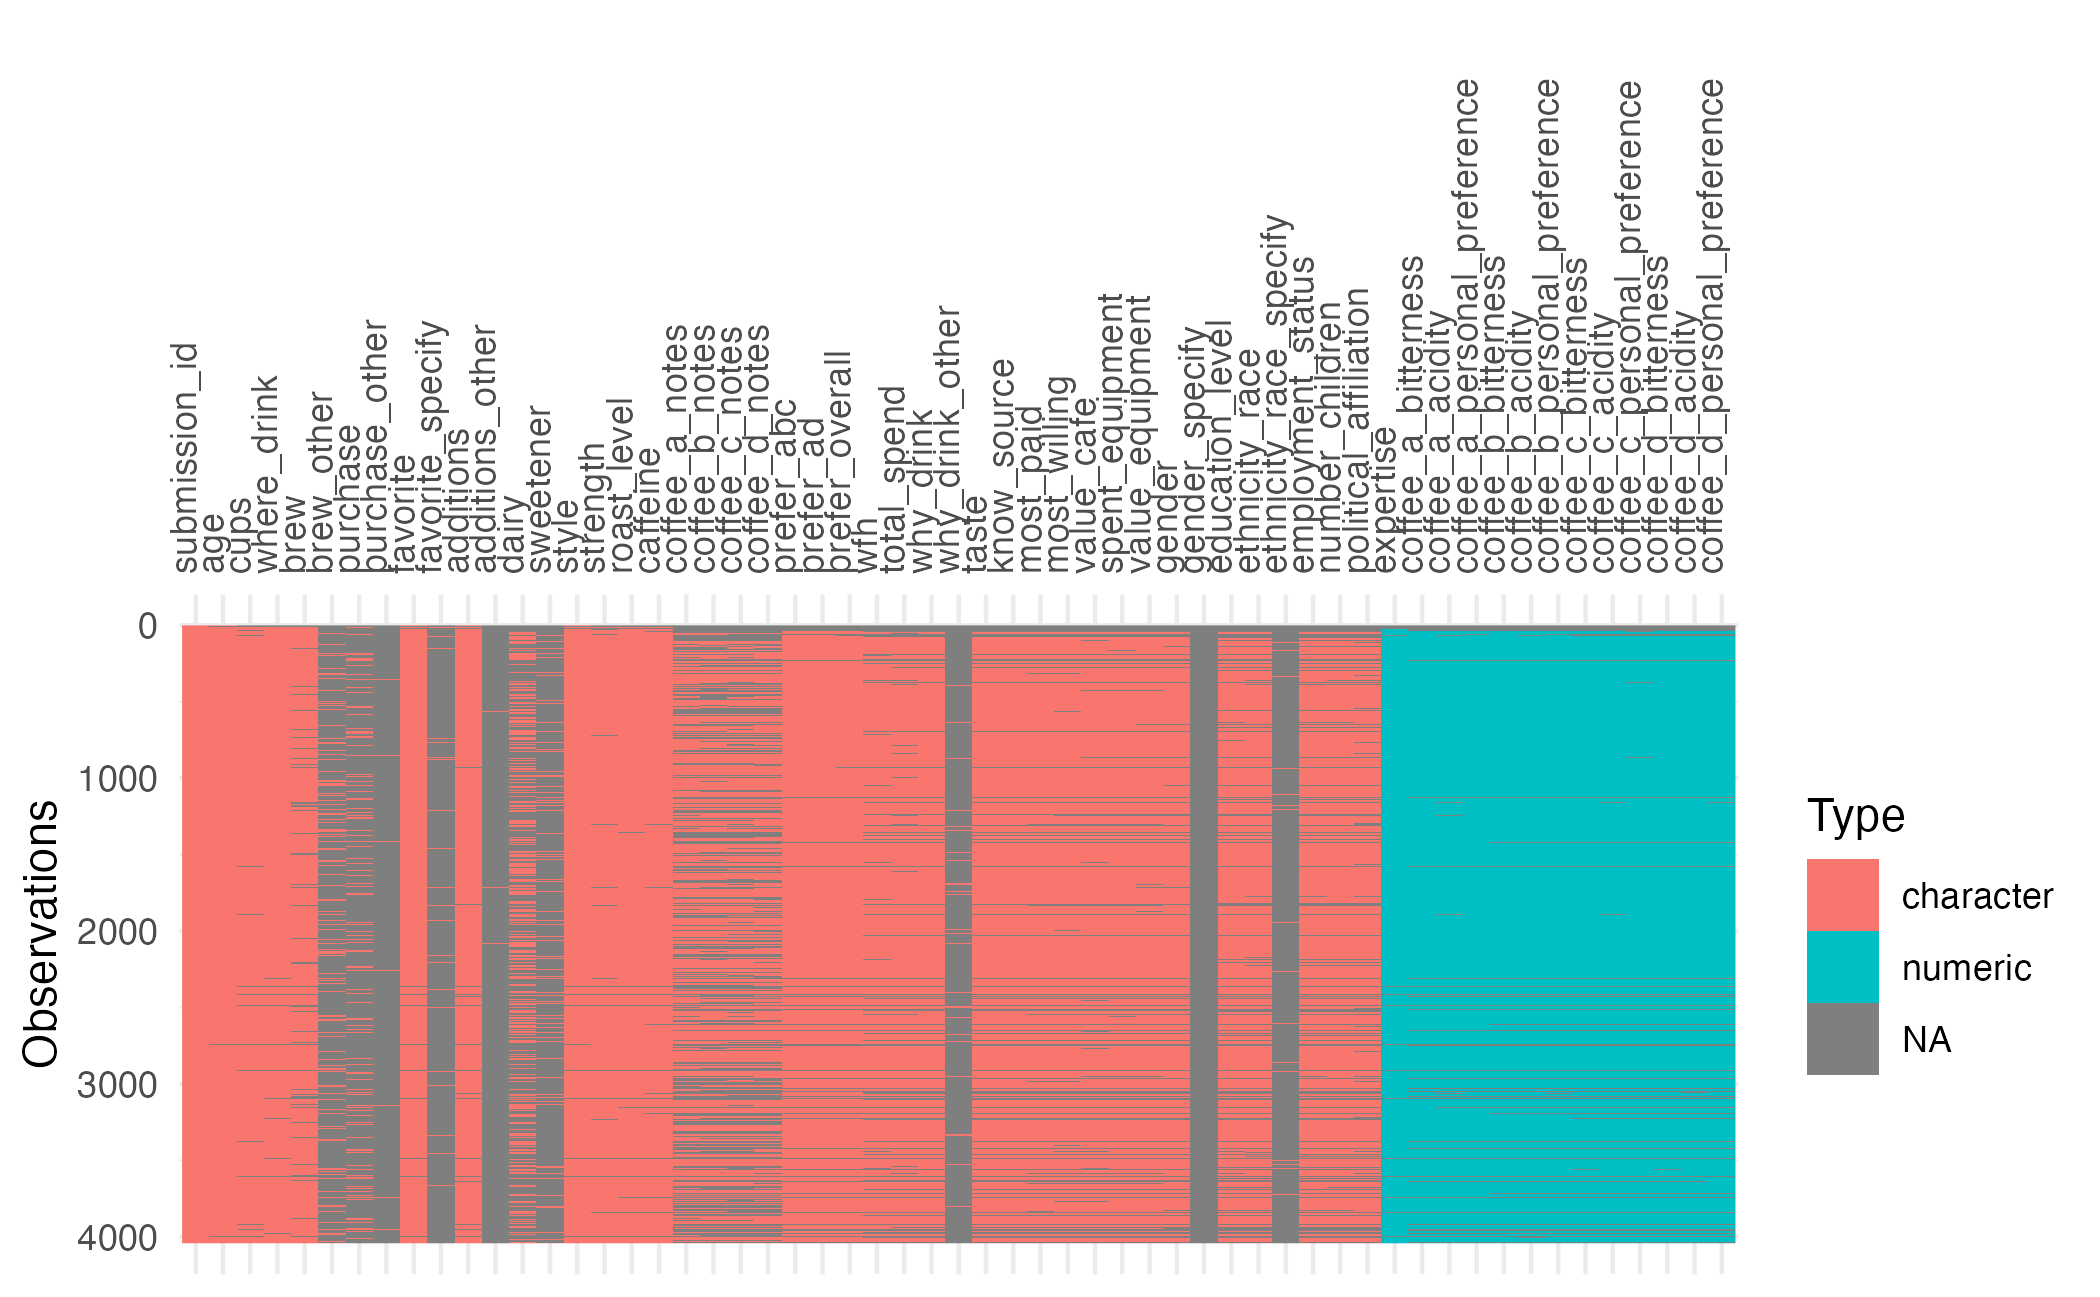
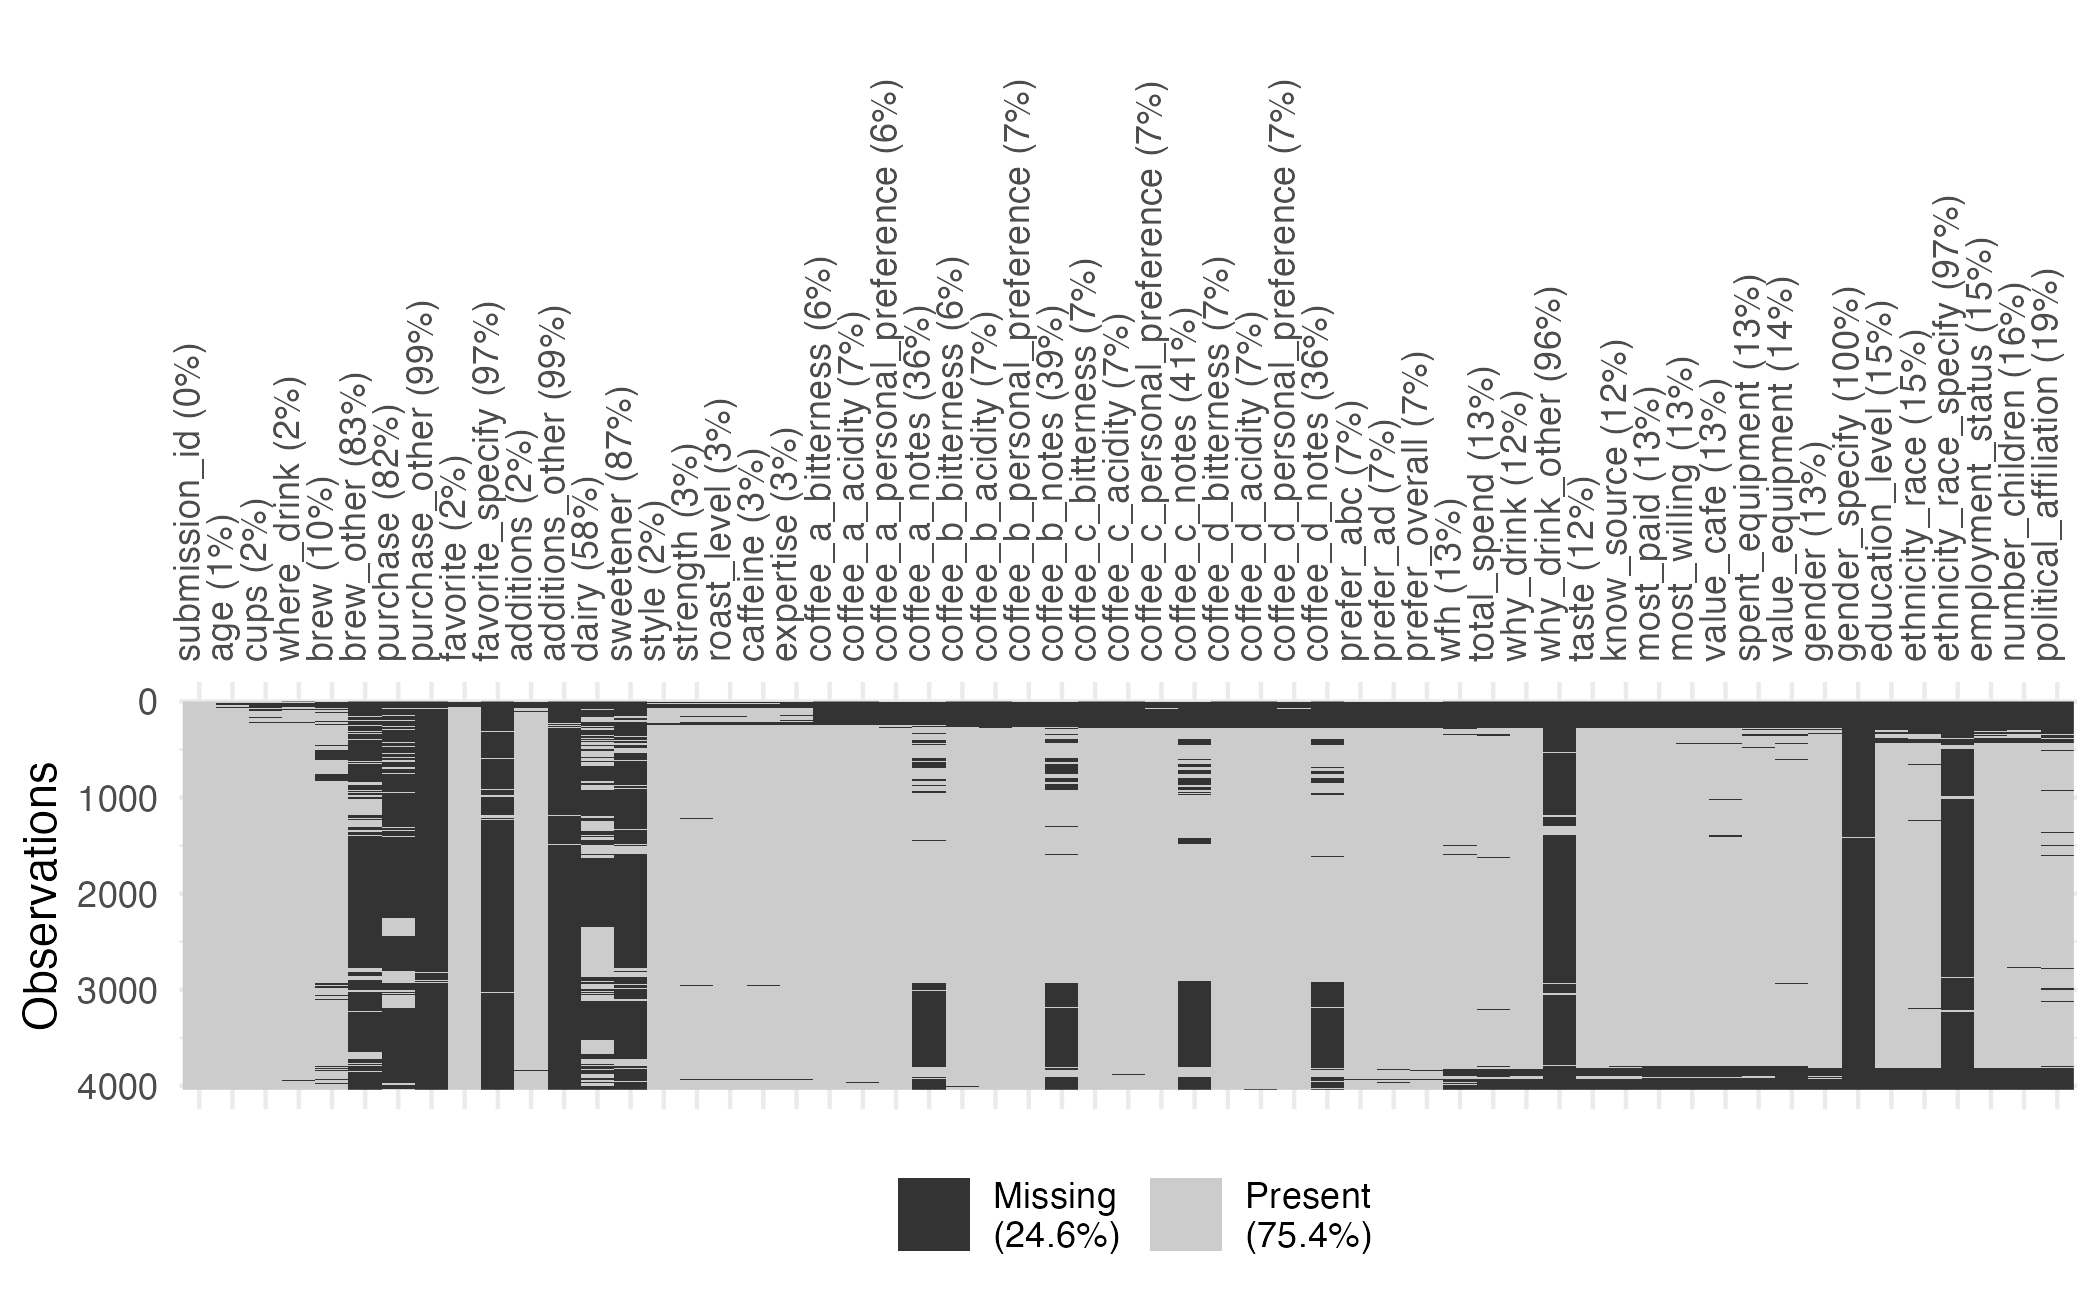
Visualizing missingness patterns
Use missingno to visualize missingness patterns.
Visualizing missingness patterns
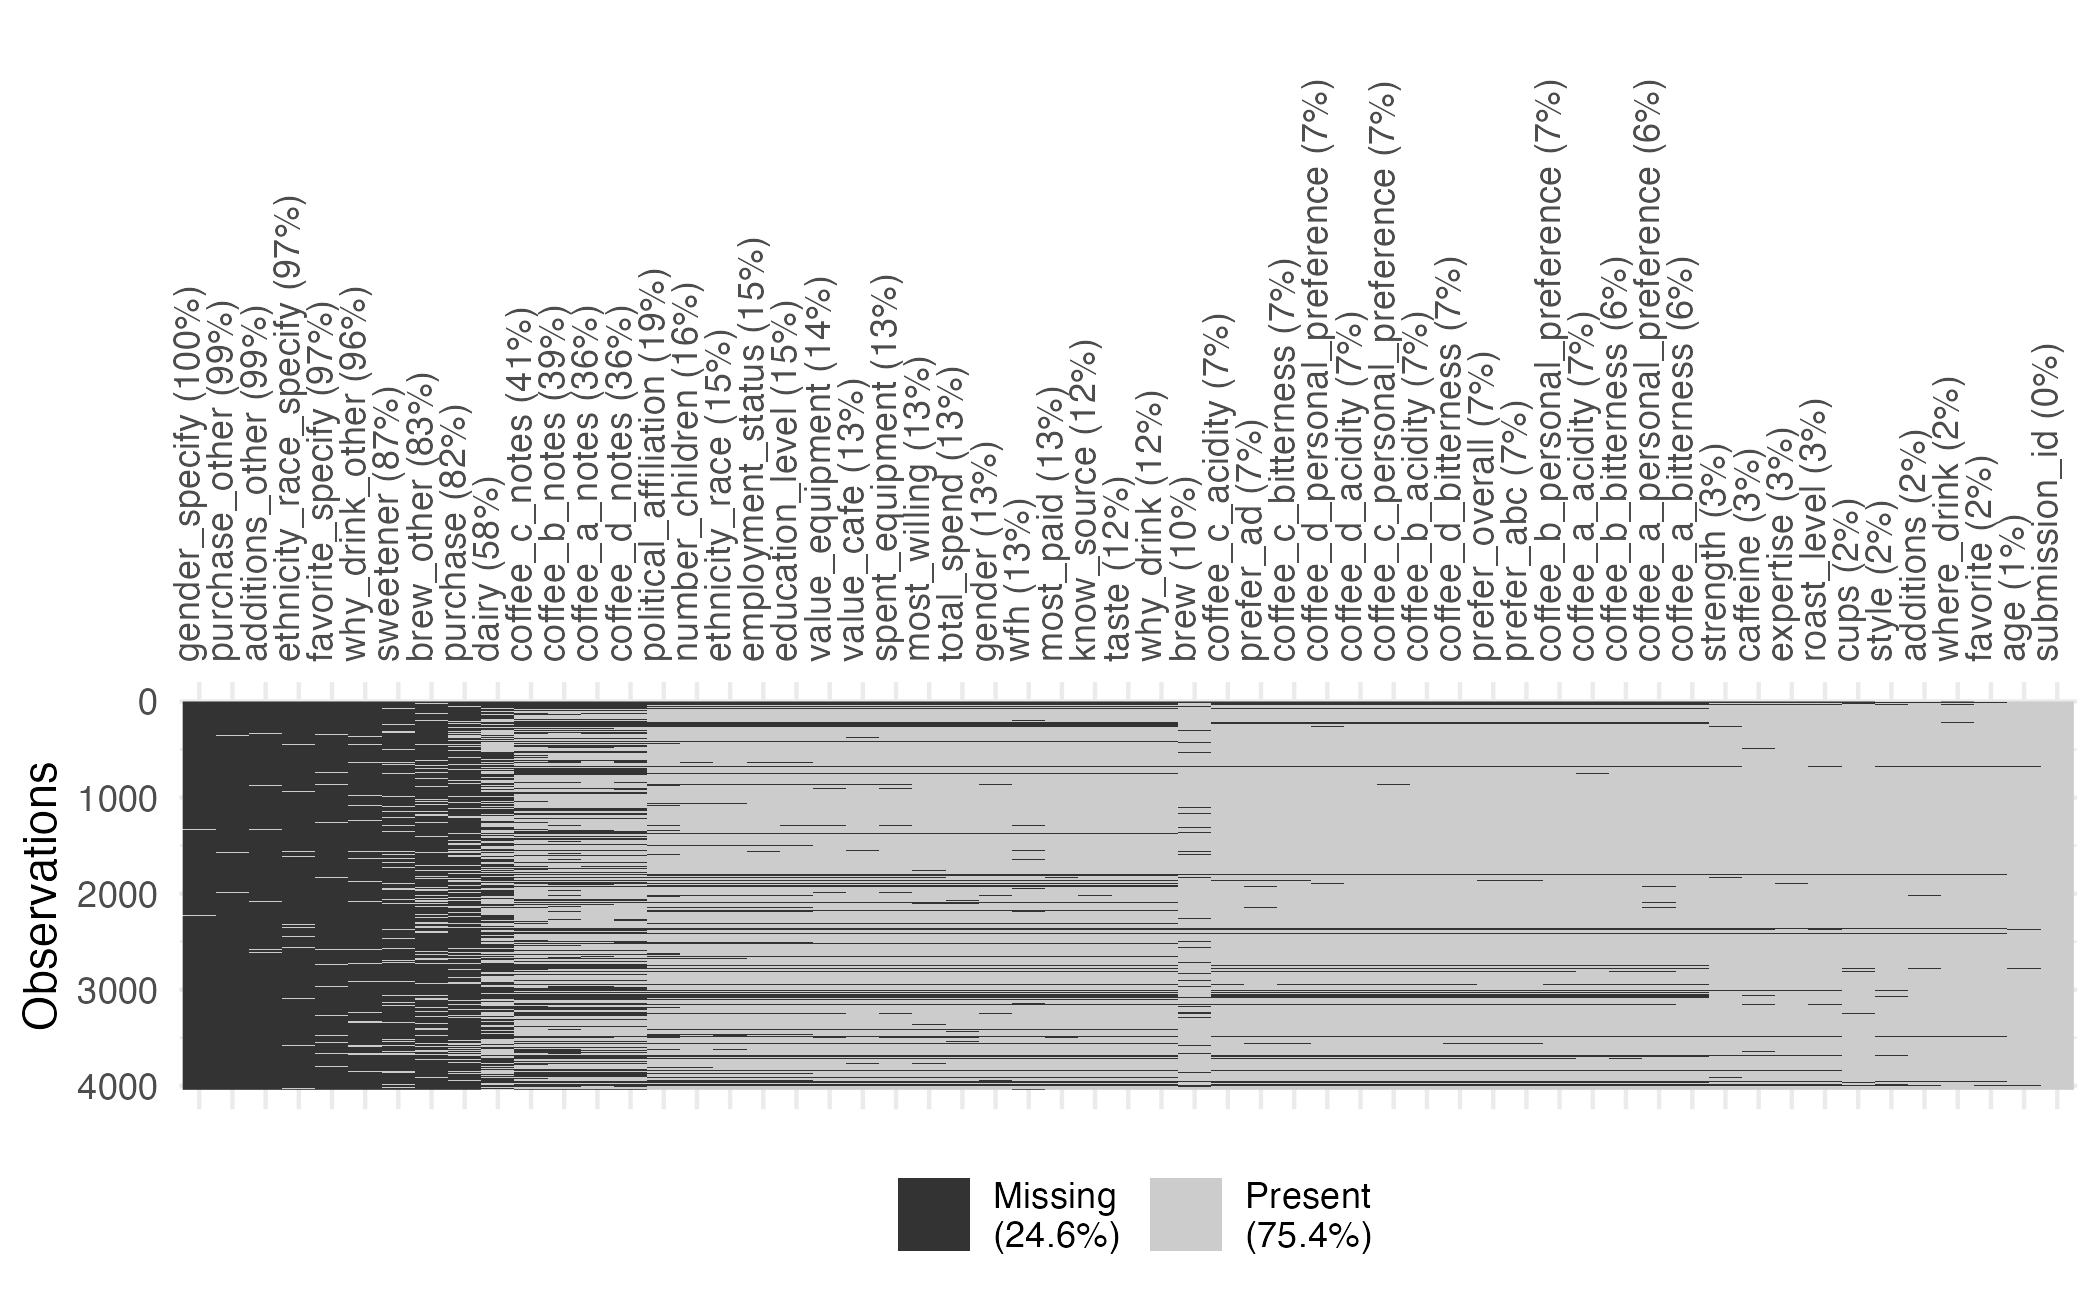
Visualizing missingness patterns
Outliers
Cases which are far away from the bulk of the data
- Error
- Extreme value
- Rare value
- Unusual value
Often is context-dependent based on who or what is in the data set.
What to do about outliers
- True errors? Remove them
- Only certain features
- Drop observation entirely
- Imputation
- Transformations
📝 Relationship with outcome
Instructions
Examine the quality of the data set. Document your analysis in the Quarto notebook.
08:00
Wrap-up
Recap
- Exploratory data analysis is critical for understanding your data
- Use visualizations to explore numeric and categorical variables
- Identify and address missingness and outliers
- Document your exploratory steps in a reproducible document
- Generate ideas that you will implement and evaluate in the modeling stage