HW 02 - Build better data
Homework
Important
This homework is due September 17 at 11:59pm ET.
Learning objectives
- Define and fit machine learning models
- Define data preprocessing and feature engineering steps for predictive models
- Estimate a range of model types
- Utilize exploratory analysis and domain expertise to inform feature engineering and model selection
Getting started
Go to the info4940-fa25 organization on GitHub. Click on the repo with the prefix hw-02. It contains the starter documents you need to complete the lab.
Clone the repo and start a new workspace in Positron. See the Homework 0 instructions for details on cloning a repo and starting a new R project.
General guidance
TipGuidelines + tips
- Set your random seed to ensure reproducible results.
- Use caching to speed up the rendering process.
- Use parallel processing to speed up rendering time. Note that this works differently on different systems and operating systems, and it also makes it harder to debug code and track progress in model fitting. Use at your own discretion.
Remember that continuing to develop a sound workflow for reproducible data analysis is important as you complete this homework and other assignments in this course. There will be periodic reminders in this assignment to remind you to render, commit, and push your changes to GitHub. You should have at least 3 commits with meaningful commit messages by the end of the assignment.
TipWorkflow + formatting
Make sure to
- Update author name on your document.
- Label all code chunks informatively and concisely.
- Follow consistent code style guidelines.
- Make at least 3 commits.
- Resize figures where needed, avoid tiny or huge plots.
- Turn in an organized, well formatted document.
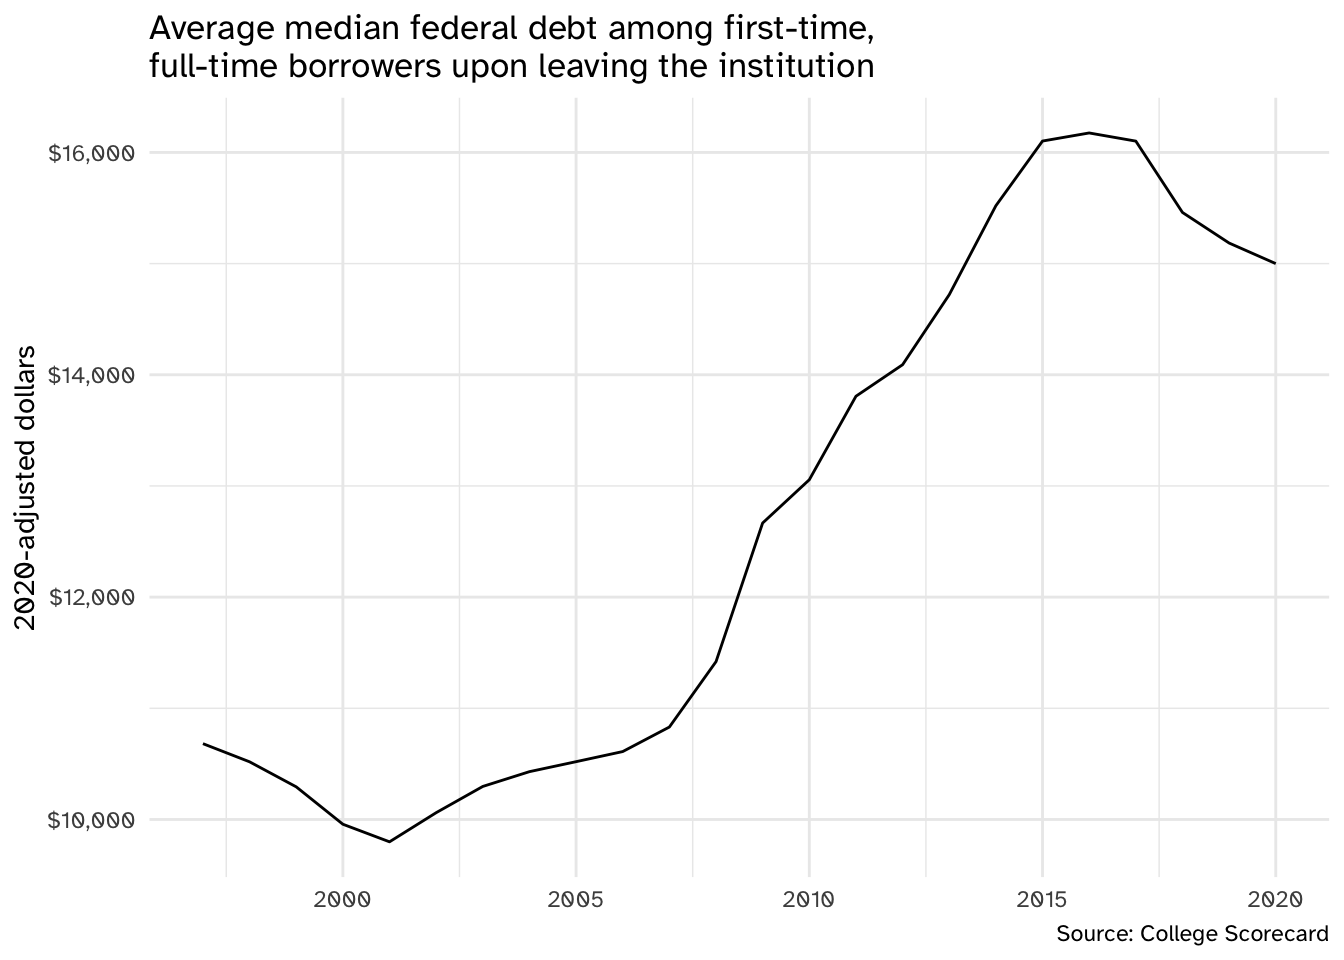
Student debt in the United States
Median student debt in the United States has increased substantially over the past twenty years.
data/scorecard.csv contains a portion of the database1 for academic year 2022-23 with the following variables:
| Column name | Variable description |
|---|---|
unit_id |
Unit ID for institution |
name |
Institution name |
state |
State postcode |
act_med |
Median ACT score for admitted students |
adm_rate |
Admission rate |
comp_rate |
Completion rate for first-time, full-time students |
cost_net |
The average annual total cost of attendance, including tuition and fees, books and supplies, and living expenses for all full-time, first-time, degree/certificate-seeking undergraduates, minus the average grant/scholarship aid |
cost_sticker |
The average annual total cost of attendance, including tuition and fees, books and supplies, and living expenses for all full-time, first-time, degree/certificate-seeking undergraduates |
death_pct |
Percent of student who died within 4 years at original institution |
debt |
Median debt of student graduating in 2022-23 |
earnings_med |
Median earnings of students working and not enrolled 6 years after entry |
earnings_sd |
Standard deviation of earnings of students working and not enrolled 6 years after entry |
faculty_salary_mean |
Average faculty salary |
faculty_full_time |
Proportion of faculty that are full-time |
female |
Share of female students |
first_gen |
Share of first-generation students |
instruct_exp |
Instructional expenditures per full-time student |
locale |
Locale of institution |
median_hh_inc |
Median household income of students |
open_admissions |
Open admissions policy |
pbi |
Predominantly black institution |
pell_pct |
Percentage of student who receive a Pell grant |
retention_rate |
First-time, full-time student retention rate |
sat_mean |
Average (mean) SAT score of admitted students |
test_policy |
Test score requirements for admission |
type |
Type of institution |
veteran |
Share of veteran students |
women_only |
Women-only college |
Our goal is to predict the median debt of students graduating in 2022-23.
Exercise 1
Import and partition the data. Import the data and reproducibly partition it into training and test sets. Briefly justify your choice of partitioning strategy.
NoteRemove rows with missing values for
debt
Prior to partitioning the data, remove any rows with missing values for the outcome variable debt.2 You may leave rows with missing values for predictor variables in the dataset.
This is an example of a data preprocessing action that actually should be done before partitioning the data, since it involves the outcome variable.
Exercise 2
Inspect the distribution of the outcome variable debt and conduct exploratory analysis with potential features of interest. Use visualizations and summary statistics to explore the data focusing on the outcome of interest and at least five other variables. Summarize your findings.
Exercise 3
Resample the training data and fit a null model. Resample the training data using an appropriate method (justify your choice) and fit a null model to establish a baseline of comparison. Interpret the results of the null model.
NoteMetrics for evaluation
For all models in this assignment, estimate and interpret the root mean squared error (RMSE) and mean absolute error (MAE).
Exercise 4
Train a basic linear regression model. Train a linear regression model using all features in the dataset. Be sure to exclude unit_id and name as predictors since they are ID columns and have no predictive value. Implement the following data preprocessing steps as part of your modeling workflow:
- Impute missing values with arithmetic means/modes for numerical/nominal predictors, respectively
- Convert categorical variables to dummy variables
- Remove zero-variance predictors
- Remove highly collinear predictors
Evaluate the model’s performance and compare it to the null model.
Exercise 5
Use feature engineering to improve the linear regression model. Use your exploratory analysis from Exercise 2 and domain expertise to inform additional data preprocessing/feature engineering steps that may improve model performance. Document why you decided to implement these steps. Implement these steps as part of your modeling workflow, and evaluate the model’s performance. Report your improvement over the basic linear regression model from Exercise 4 as a percentage reduction in RMSE and MAE.
NoteHow much do I need to do?
Ultimately the goal is to improve the model’s performance and reduce the RMSE and MAE. There is no minimum number of feature engineering steps you need to implement, but be warned: minimal effort will likely result in minimal improvement and a low grade for the exercise. You will be evaluated in part on both your effort and the improvement you achieve.
Exercise 6
Evaluate a random forest model. Train a random forest model. Implement any required data preprocessing but do not perform any feature engineering. Evaluate the model’s performance and compare it to the linear regression models from Exercises 4 and 5.
Exercise 7
Finalize your model and evaluate on the test set. Pick the best model (explain why you decided it is the best). Train it using the entire training set (not resampled) and evaluate it using the test set. How does it compare to the null model? What about the metric from the resampled training set? How effective do you find this model to be?
Generative AI (GAI) self-reflection
As stated in the syllabus, include a written reflection for this assignment of how you used GAI tools (e.g. what tools you used, how you used them to assist you with writing code), what skills you believe you acquired, and how you believe you demonstrated mastery of the learning objectives.
Render, commit, and push one last time.
Make sure that you commit and push all changed documents and your Git pane is completely empty before proceeding.
Wrap up
Submission
- Go to http://www.gradescope.com and click Log in in the top right corner.
- Click School Credentials \(\rightarrow\) Cornell University NetID and log in using your NetID credentials.
- Click on your INFO 4940/5940 course.
- Click on the assignment, and you’ll be prompted to submit it.
- Mark all the pages associated with exercise. All the pages of your homework should be associated with at least one question (i.e., should be “checked”).
Grading
- Exercise 1: 2 points
- Exercise 1: 10 points
- Exercise 3: 4 points
- Exercise 4: 8 points
- Exercise 5: 16 points
- Exercise 6: 4 points
- Exercise 7: 6 points
- GAI self-reflection: 0 points
- Total: 50 points